

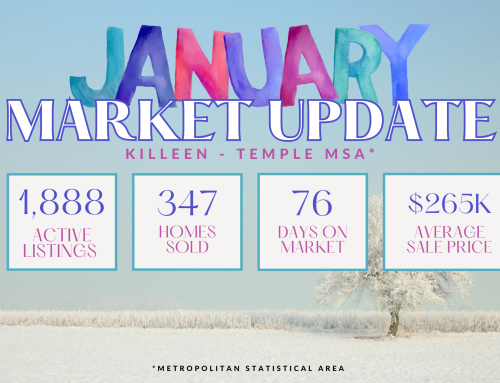
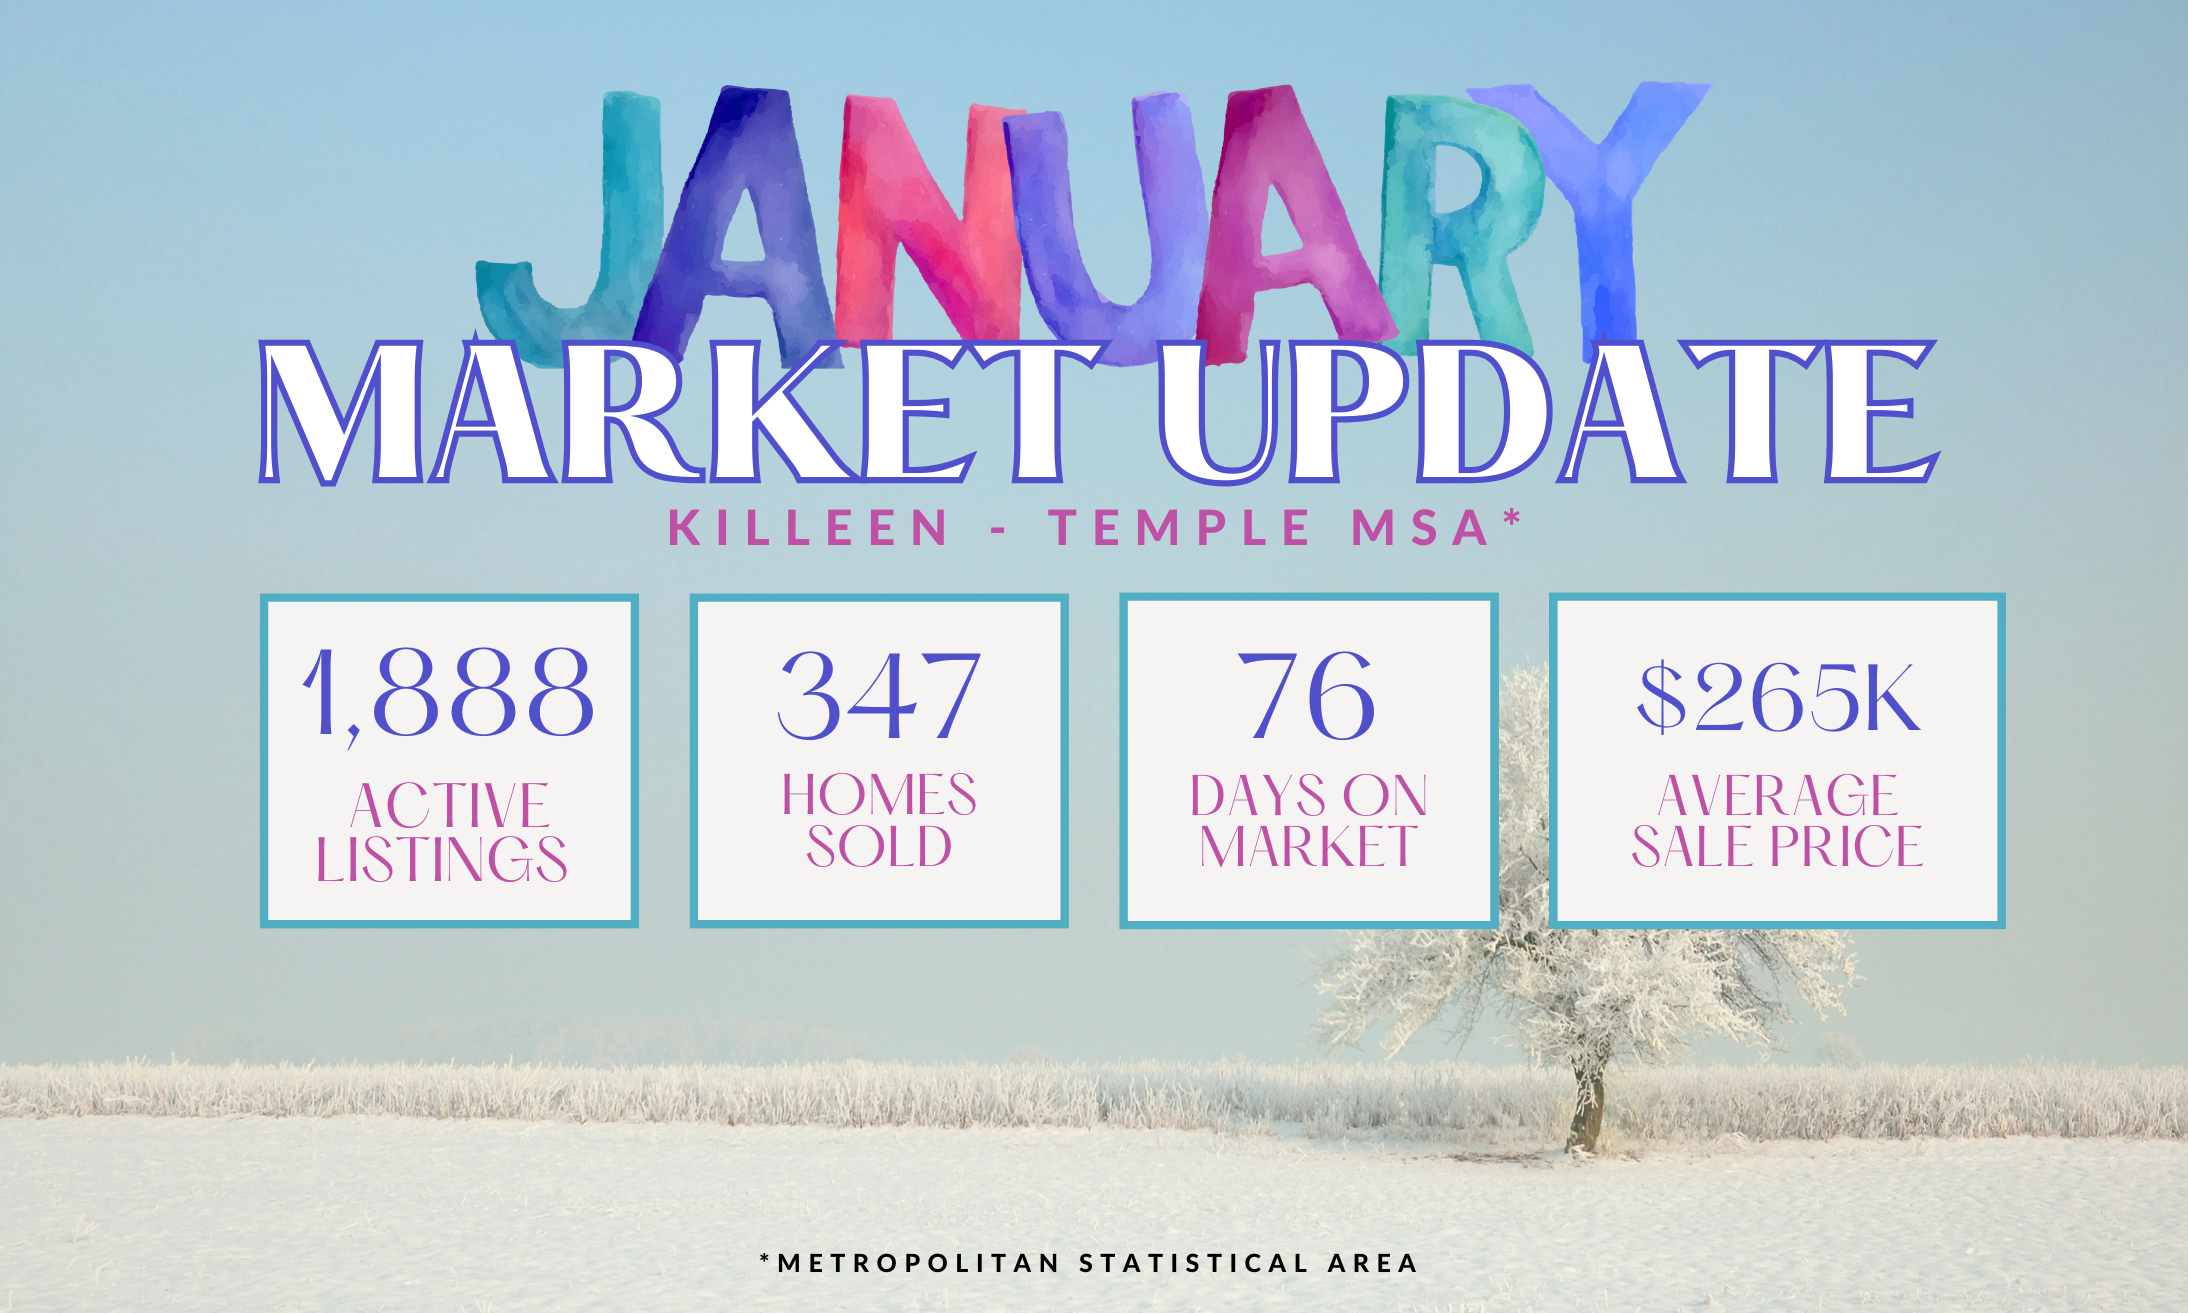
![]() When it comes to understanding the real estate market, there are several key metrics that can provide valuable insights for both buyers and sellers. Let’s dive into the correlation between these metrics and what they mean for you.
When it comes to understanding the real estate market, there are several key metrics that can provide valuable insights for both buyers and sellers. Let’s dive into the correlation between these metrics and what they mean for you.
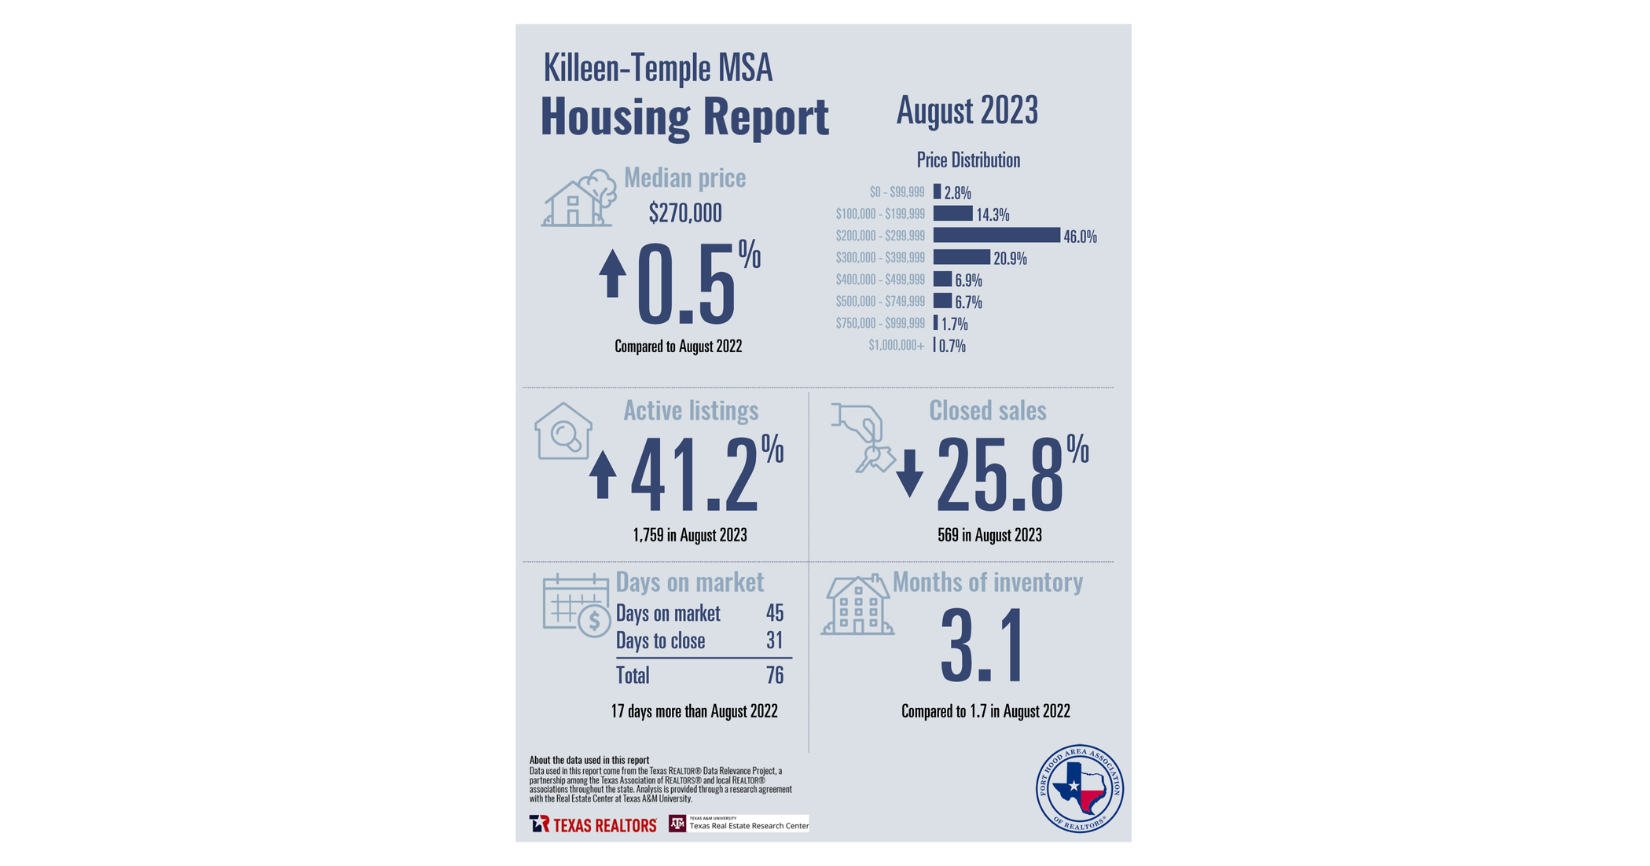
First, let’s take a look at the months supply of inventory, which stood at 31 in August. This metric represents the number of months it would take to sell all the available homes on the market, given the current sales pace. A lower months supply indicates a seller’s market, where demand outpaces supply, putting sellers in a favorable position.
However, it’s important to consider the 12-month change in months of inventory, which has seen a significant increase. This indicates there may be a shift towards a buyer’s market, where there is more supply than demand. Buyers might have more options and negotiating power in such a market.
Moving on to the median days homes are on the market, which is currently 45. This metric represents the average time it takes for a home to sell. A lower number suggests a faster-paced market, where properties are in high demand and tend to sell quickly. Conversely, a higher number indicates a slower market, where homes may take longer to sell.
Lastly, let’s take a look at the median sold price, which ended out August at $270,000. This metric represents the middle point of all the sold prices, with half of the homes selling for more and half for less. The median sold price gives you an idea of the overall price range in the market and can help both buyers and sellers determine their pricing strategies.
The increase in inventory over the past year suggests a potential shift in the market, which could provide more options and negotiation power for buyers. As a seller, it’s important to price your home strategically and be aware of the market dynamics. Ultimately, staying informed about these metrics can help you make more informed decisions in the real estate market.
Leave A Comment