

![]()
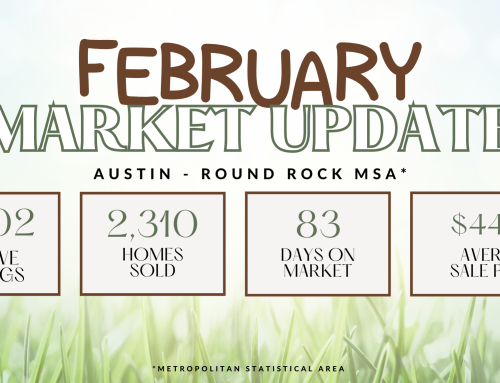
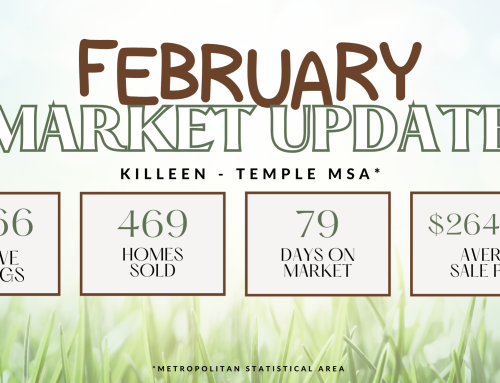
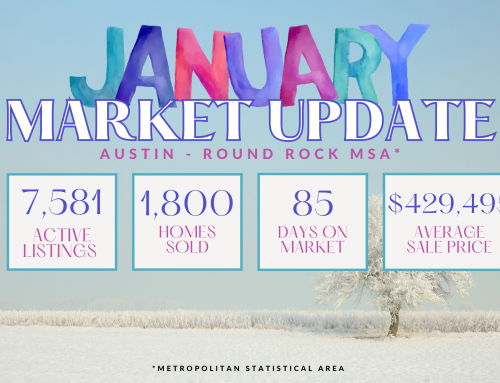
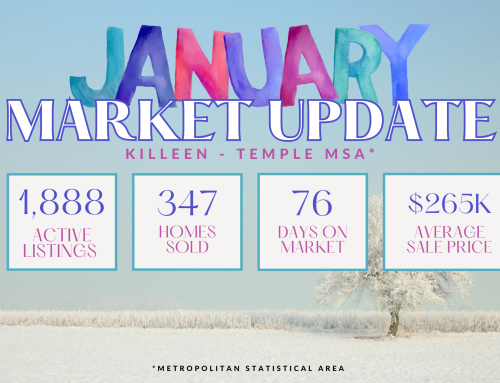
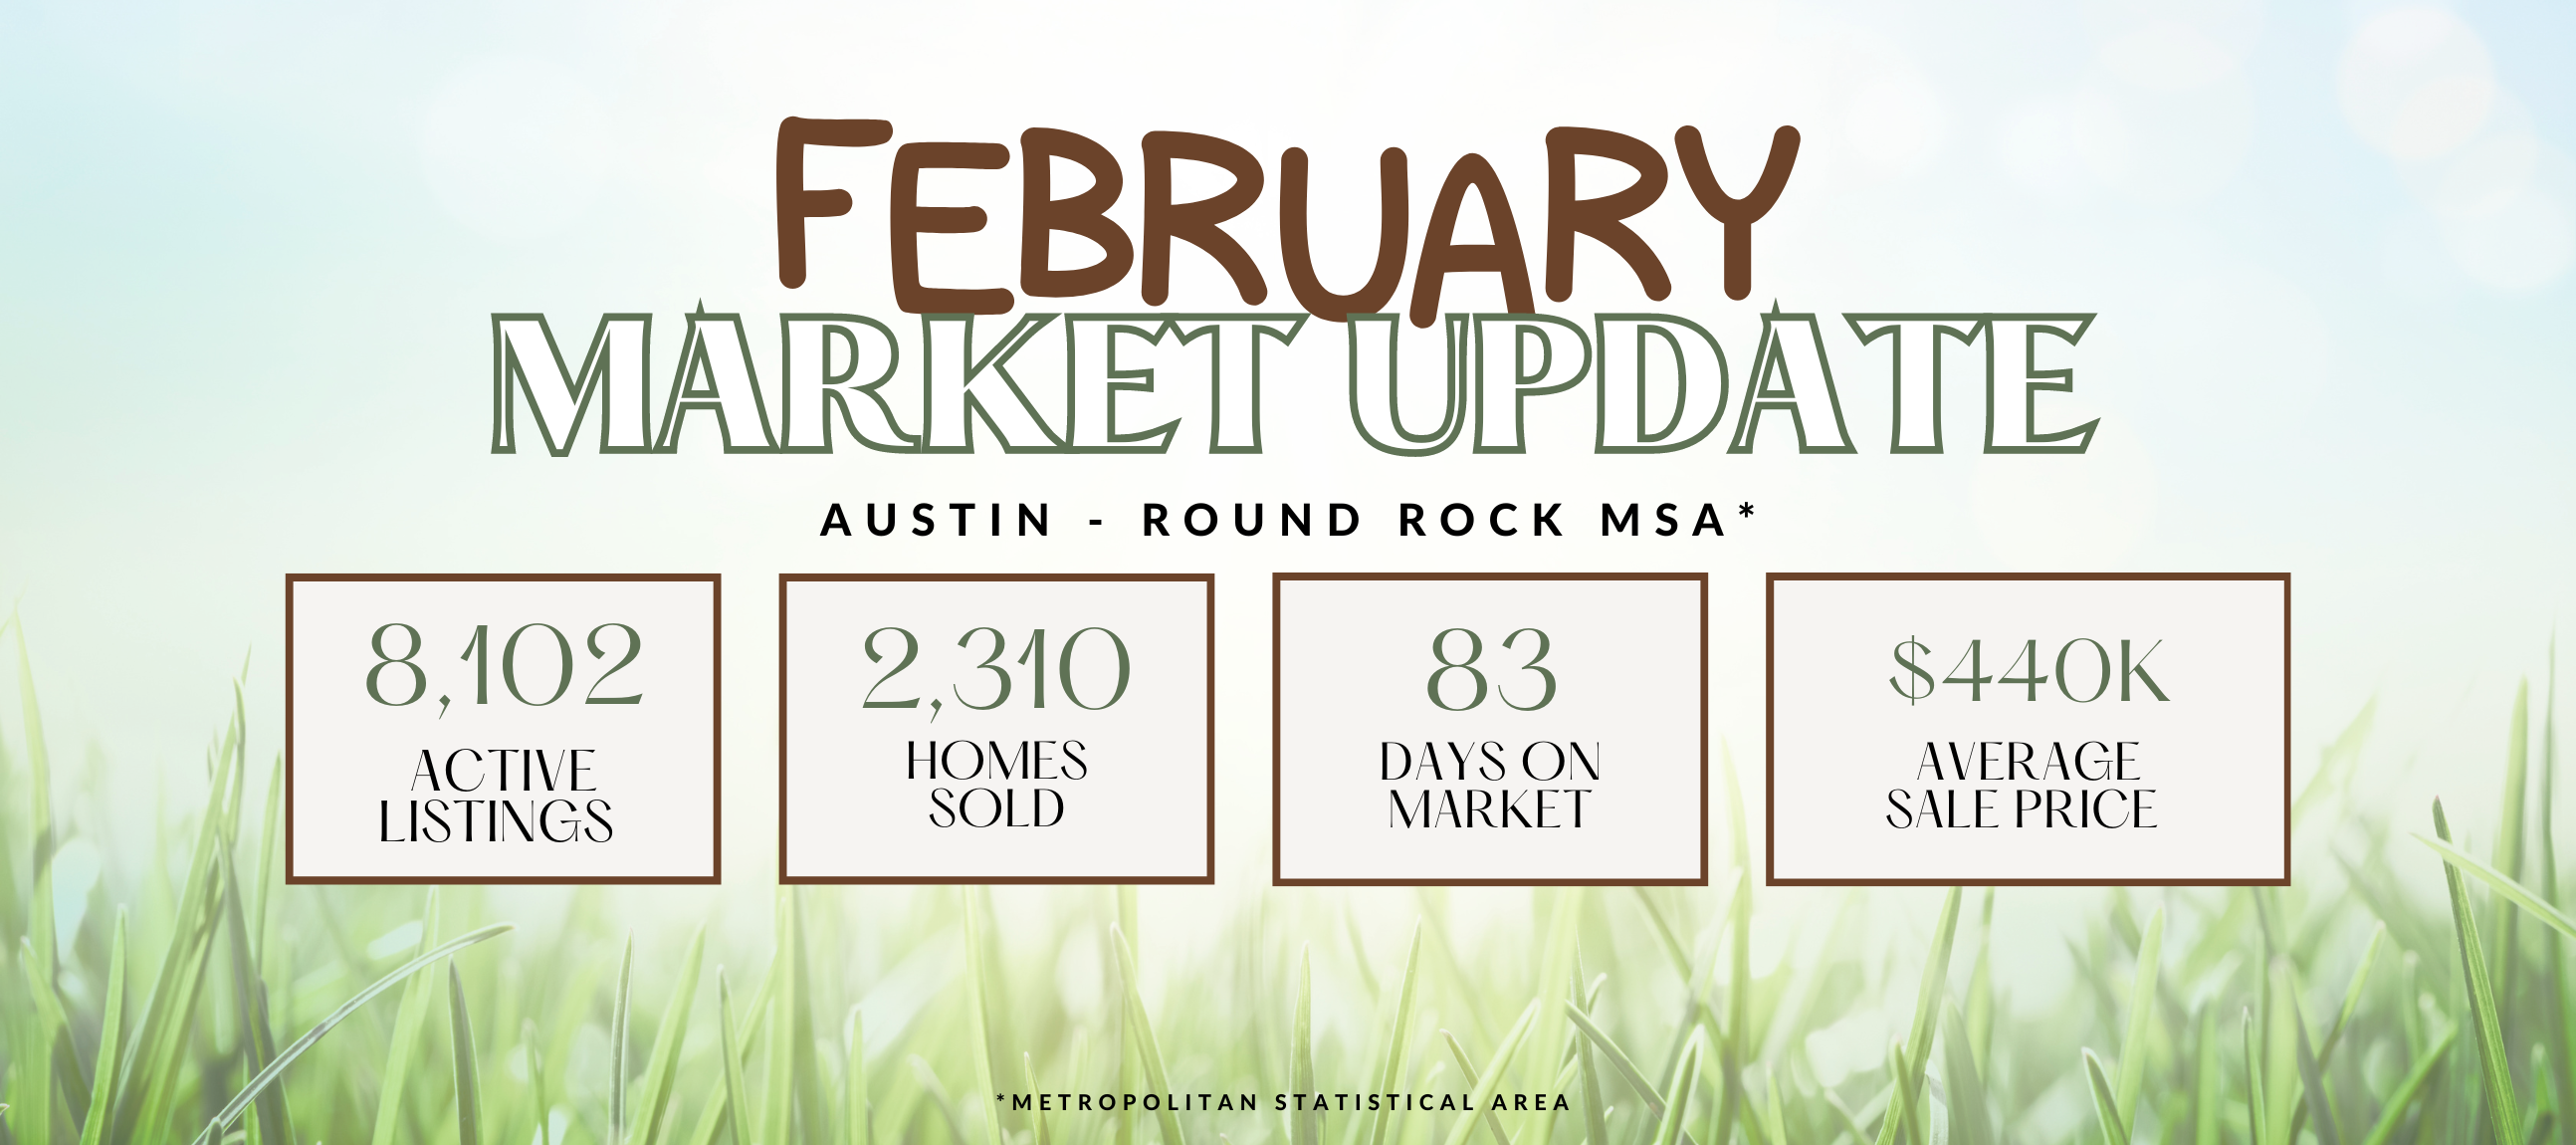
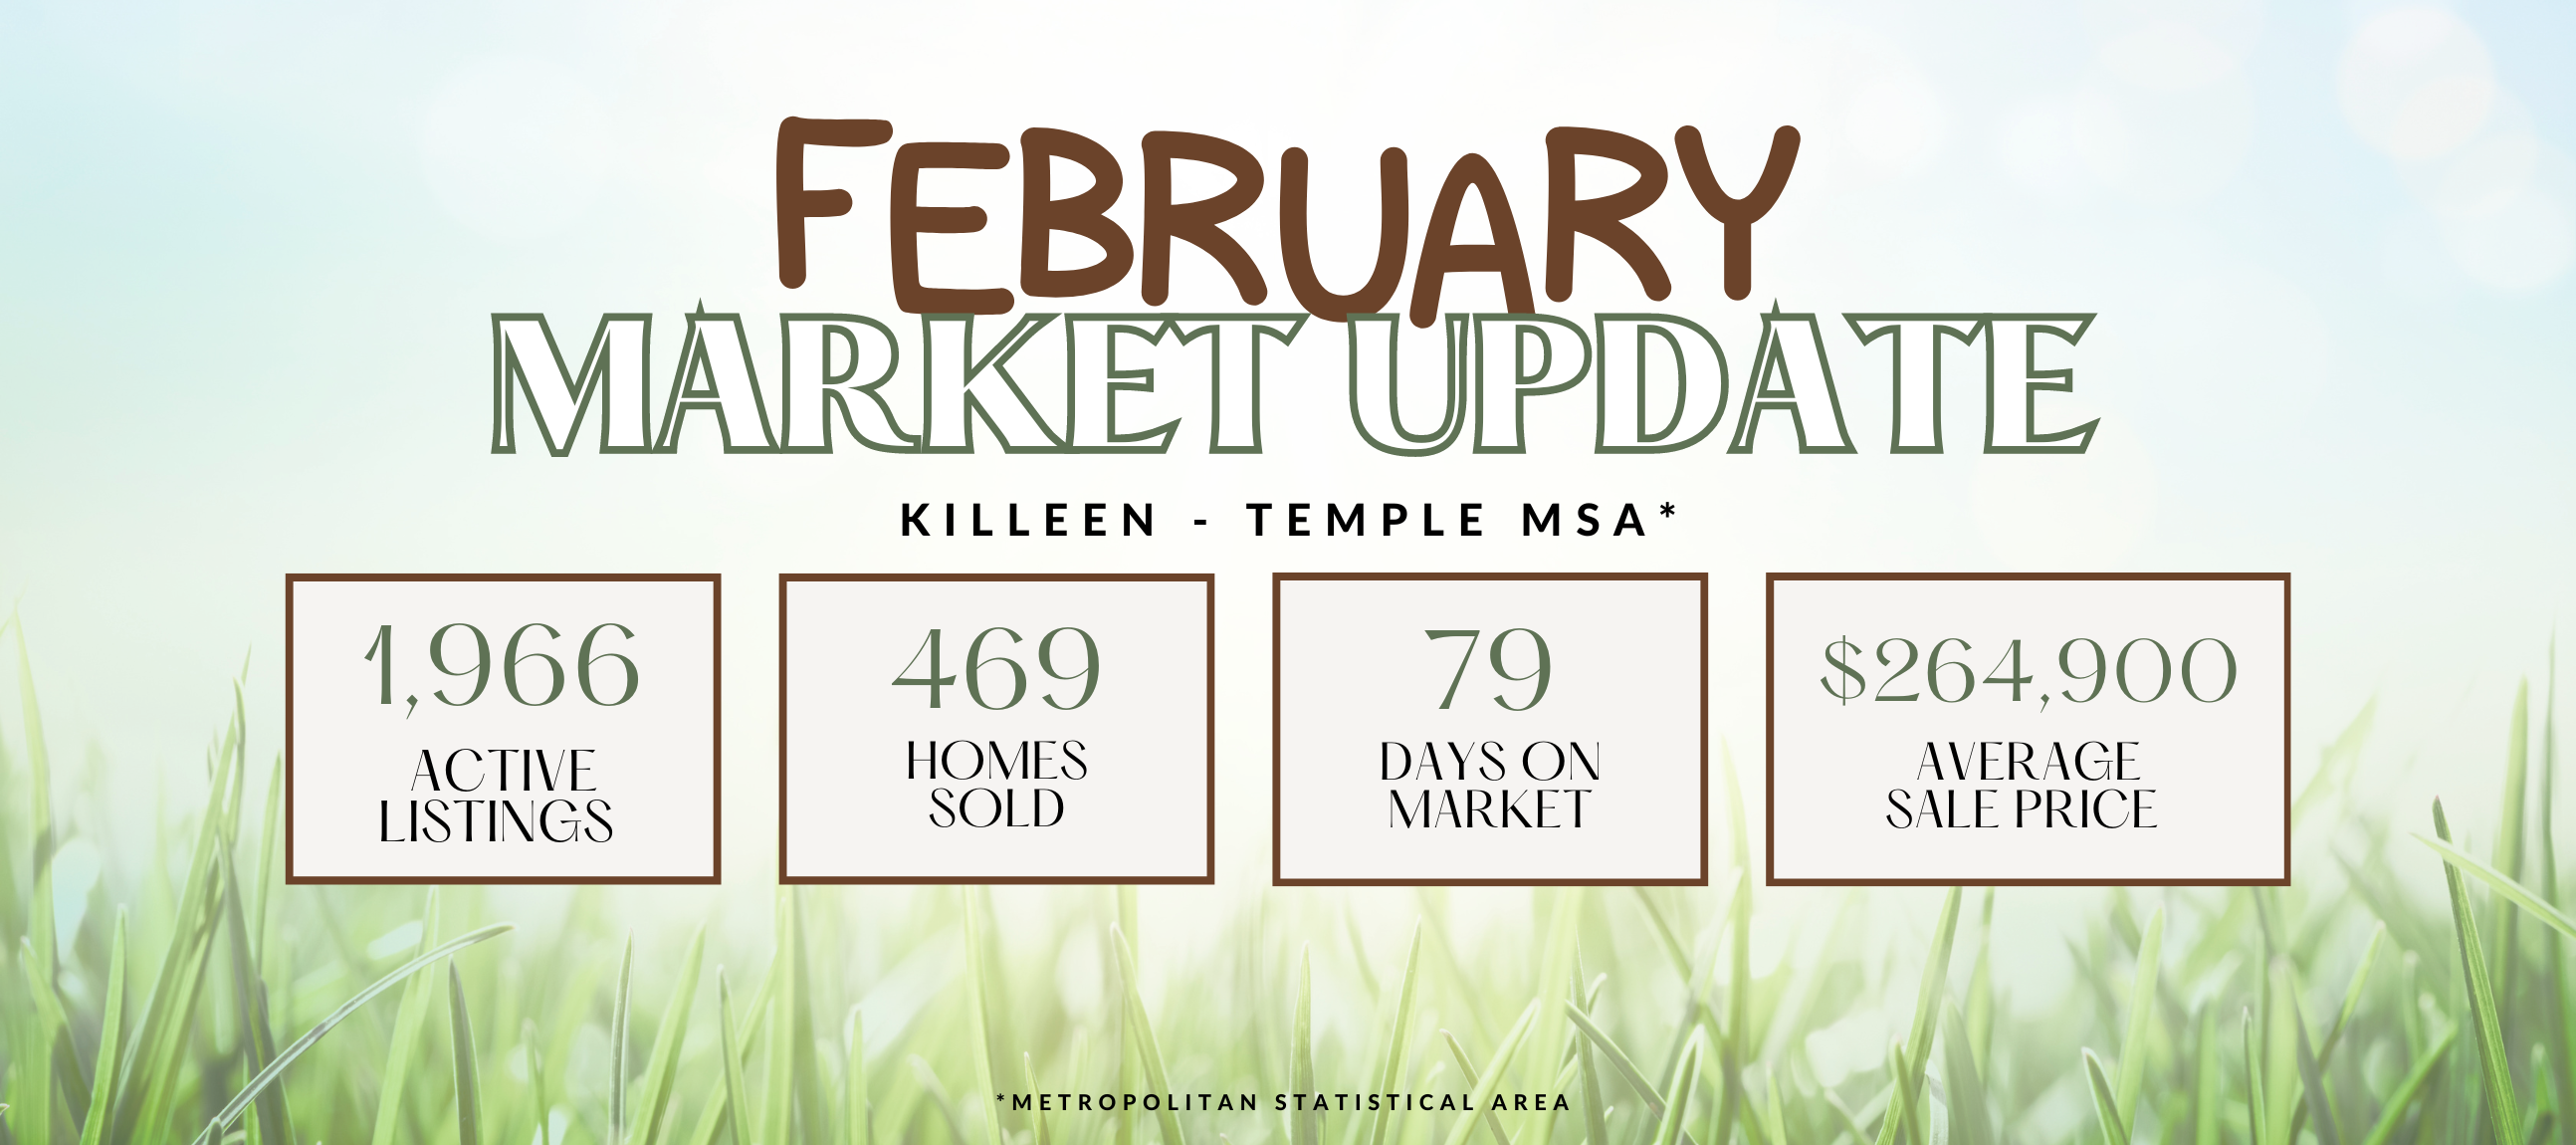
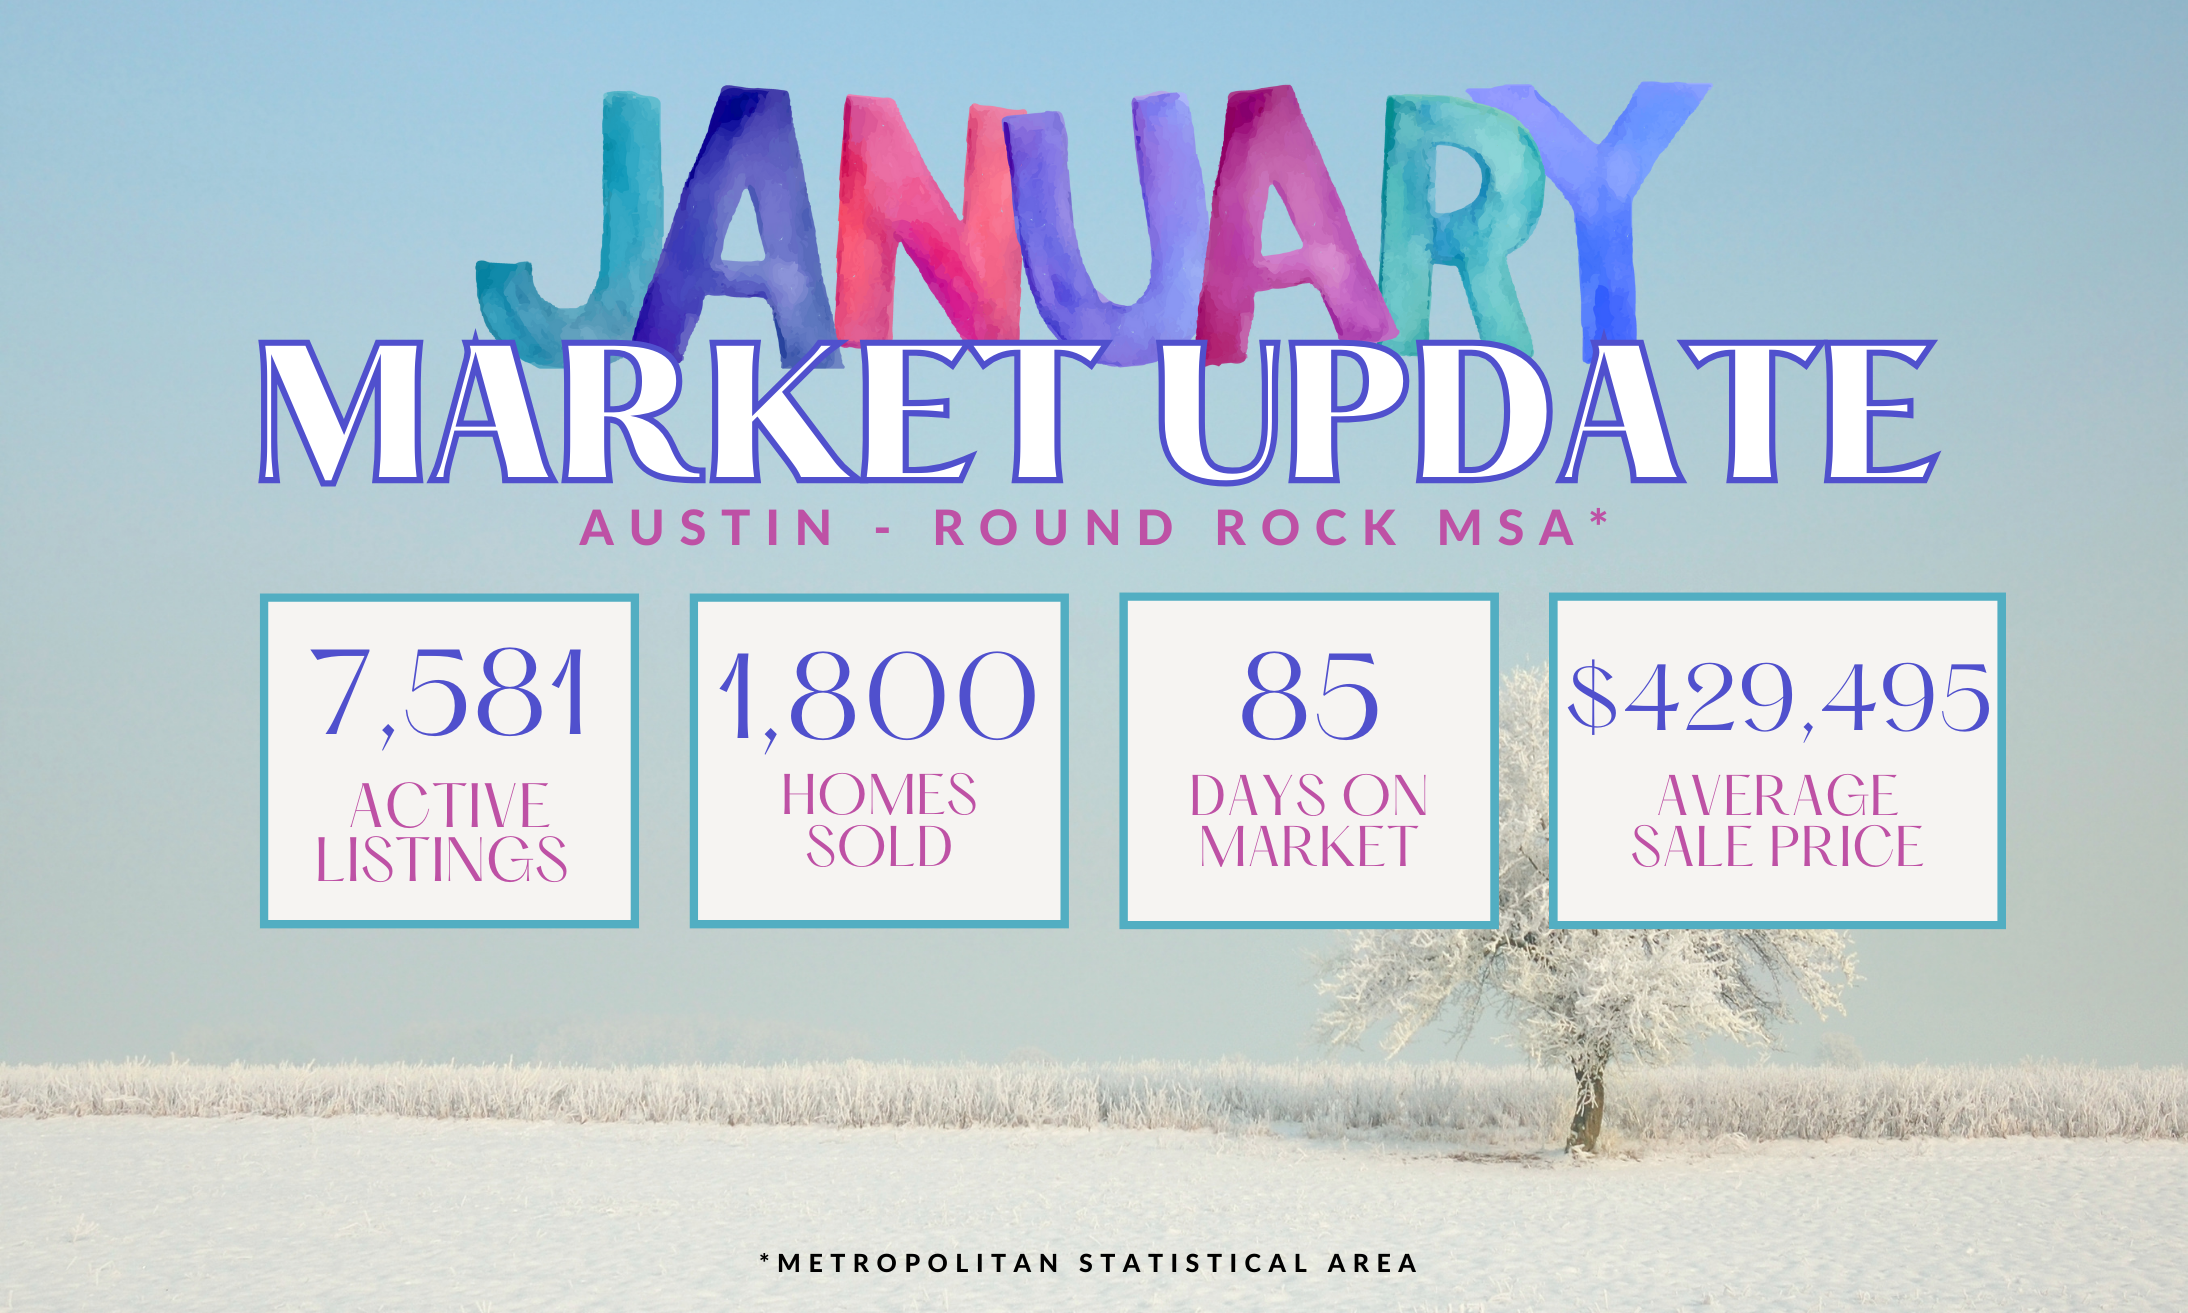
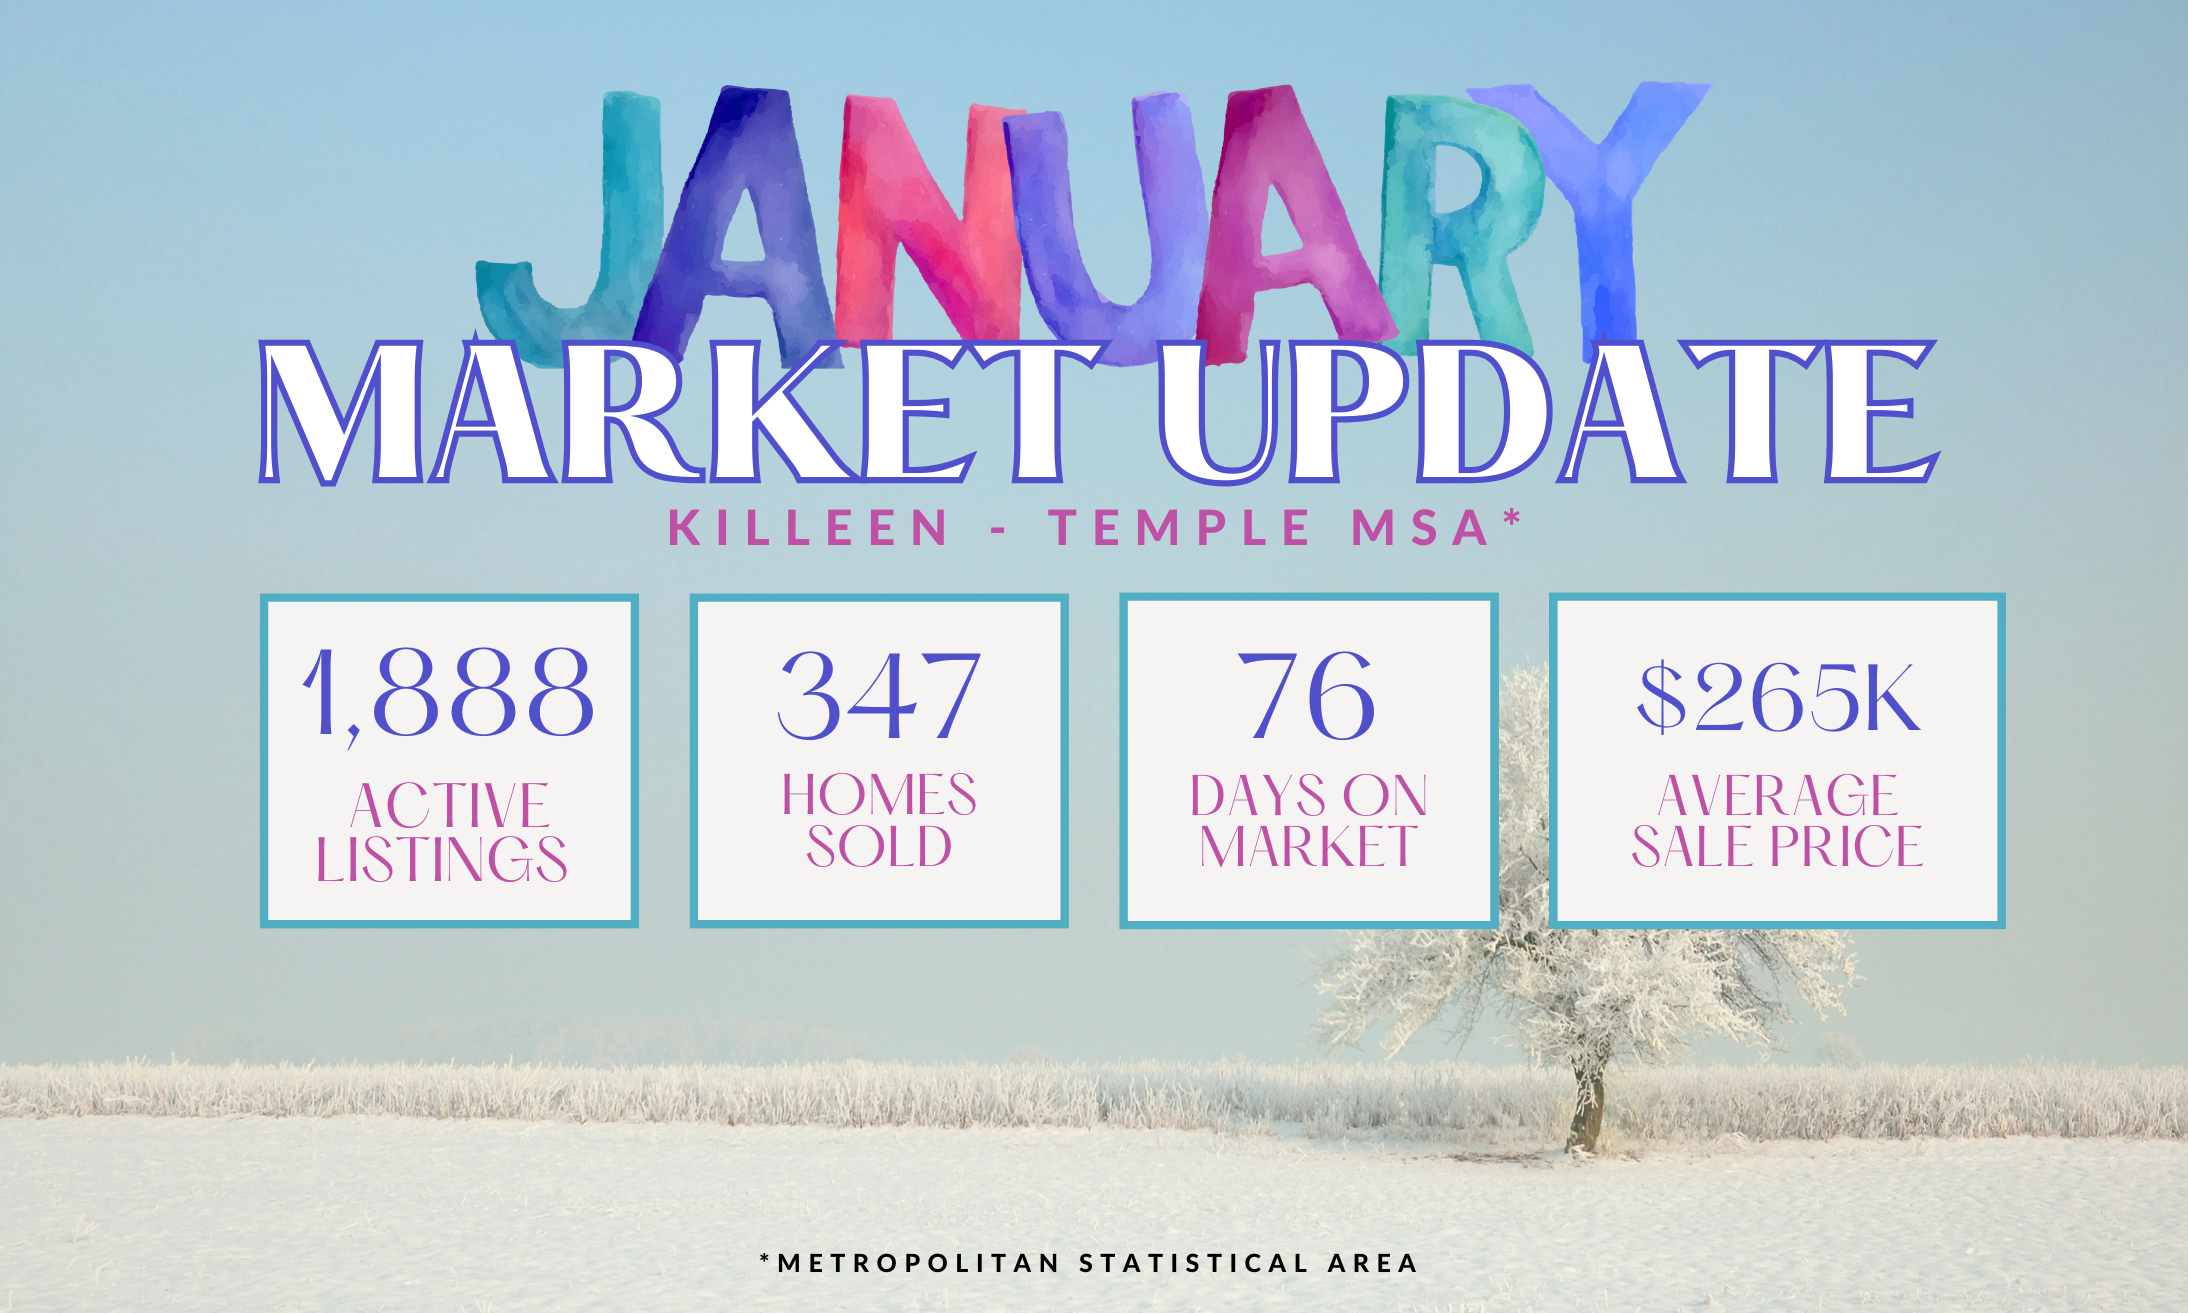
Please keep in mind this is for the entire *metropolitan statistical area. If you want zip code specific stats, I am happy to get them to you!
First up, we have the “Months Supply of Inventory,” which currently stands at 3.7. This metric indicates how many months it would take to sell all the available homes on the market, given the current pace of sales. A lower number suggests a seller’s market, where demand outpaces supply, and homes tend to sell quickly.
However, the “12-Month Change in Months of Inventory” has seen a slight increase. This means that over the past year, the supply of homes has grown relative to the demand. While we have seen an increase in active listings, inventory is still low and it presents an opportunity for buyers who now have a slightly wider range of options to choose from.
Now, let’s shift our attention to the “Median Days Homes are On the Market,” which stands at 58. This metric tells us how long, on average, it takes for a home to get under contract after being listed for sale. With a number like this, it indicates that homes are taking just a little less than 2 months to go under contract, with an average of only 30 days from getting a contract to final closing. Sellers can feel confident that their properties won’t languish on the market for extended periods (in October a total average of 88 days from list to sold), still attracting potential buyers.
We also have the “List to Sold Price Percentage,” which currently sits at a solid 95.6%. This metric represents the percentage of the original listing price that sellers typically receive when their homes are sold. A high percentage like this demonstrates that buyers are still willing to pay close to the asking price, indicating a pretty good market.
Finally, let’s talk about the “Median Sold Price,” which stands at $265,000. This metric represents the middle point of all the sold prices in a given area. It provides a benchmark to assess the overall value of homes in the market. Buyers can use this information to gauge what they might expect to pay, while sellers can use it to set a competitive asking price.
In conclusion, these real estate metrics provide us with valuable insights into the current state of the market. While there is a slight increase in the months of inventory, the other metrics suggest a healthy real estate environment. Buyers can take advantage of more options and reasonable list to sold price percentages, while sellers can benefit from a quick turnaround time and attractive median sold prices.
Remember, understanding these metrics can be a game-changer when it comes to making informed decisions in the real estate market. So whether you’re buying or selling, keep these numbers in mind, and let me know how I can help you with your home buying journey!
Leave A Comment