

![]()
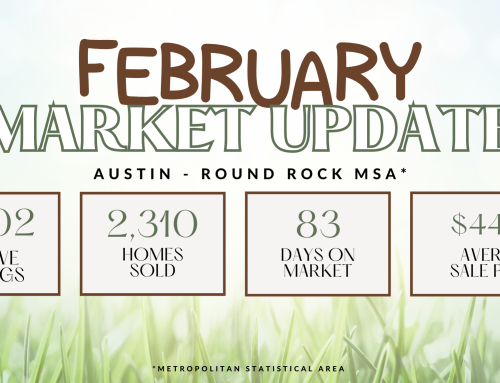
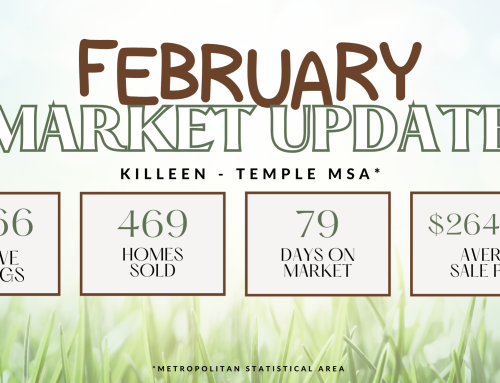
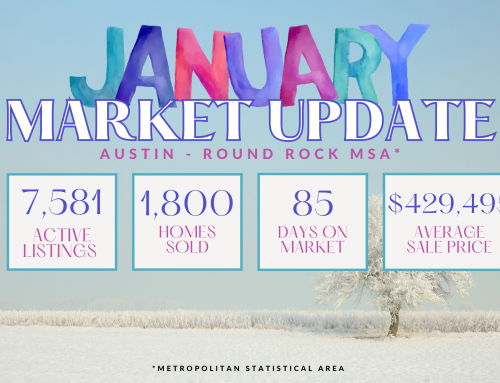
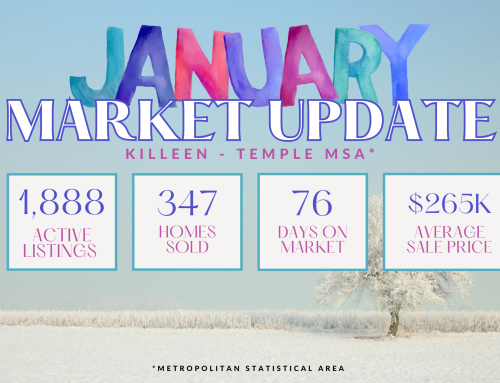
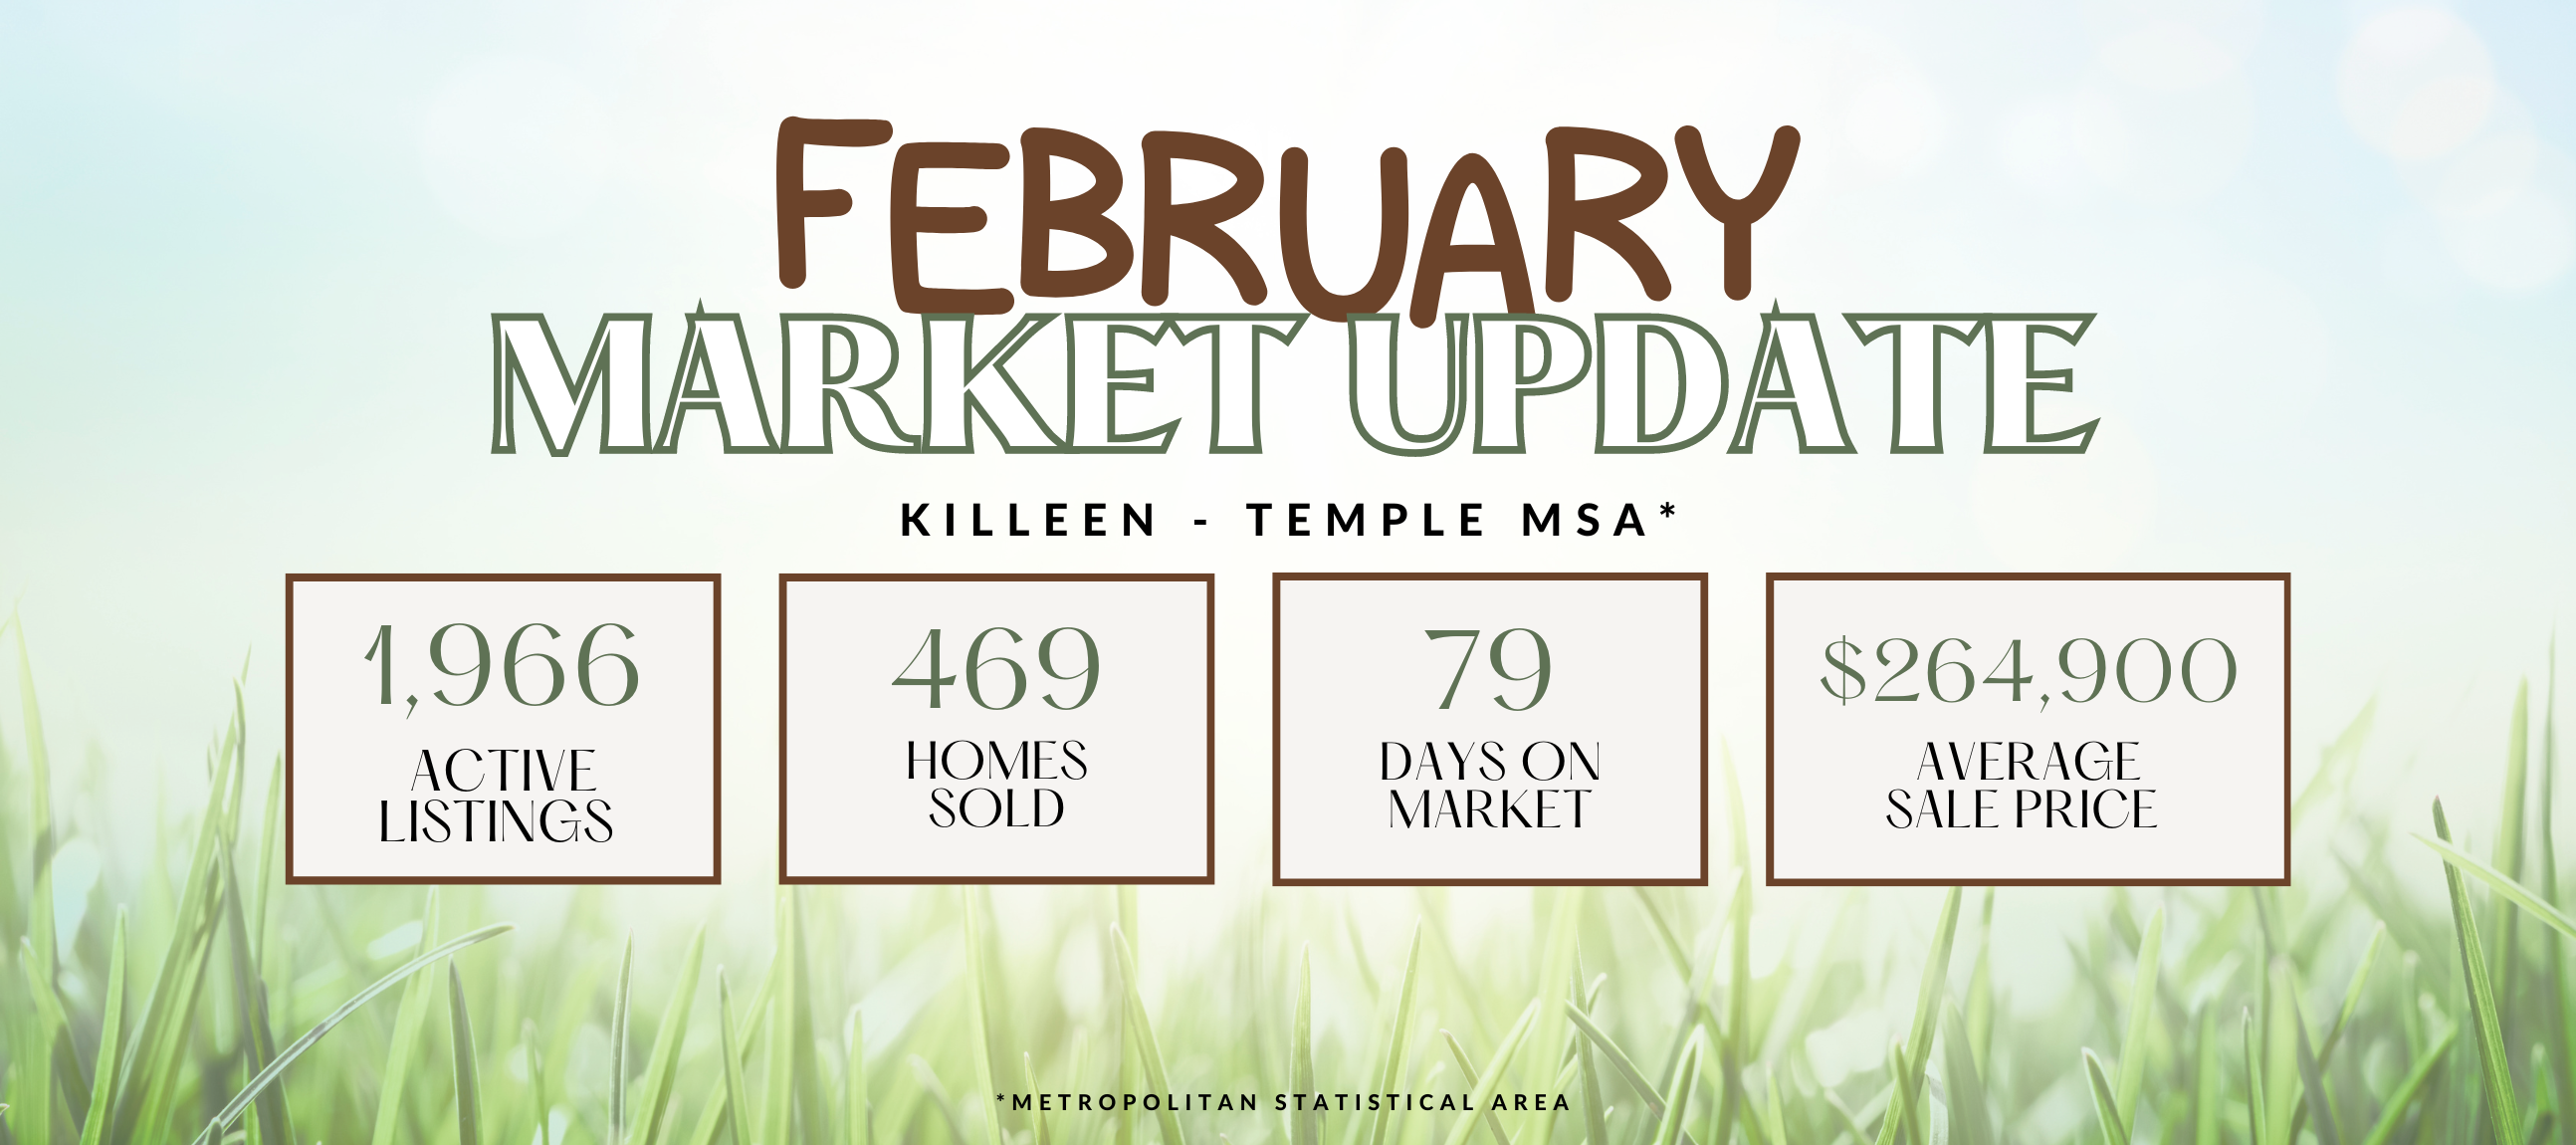
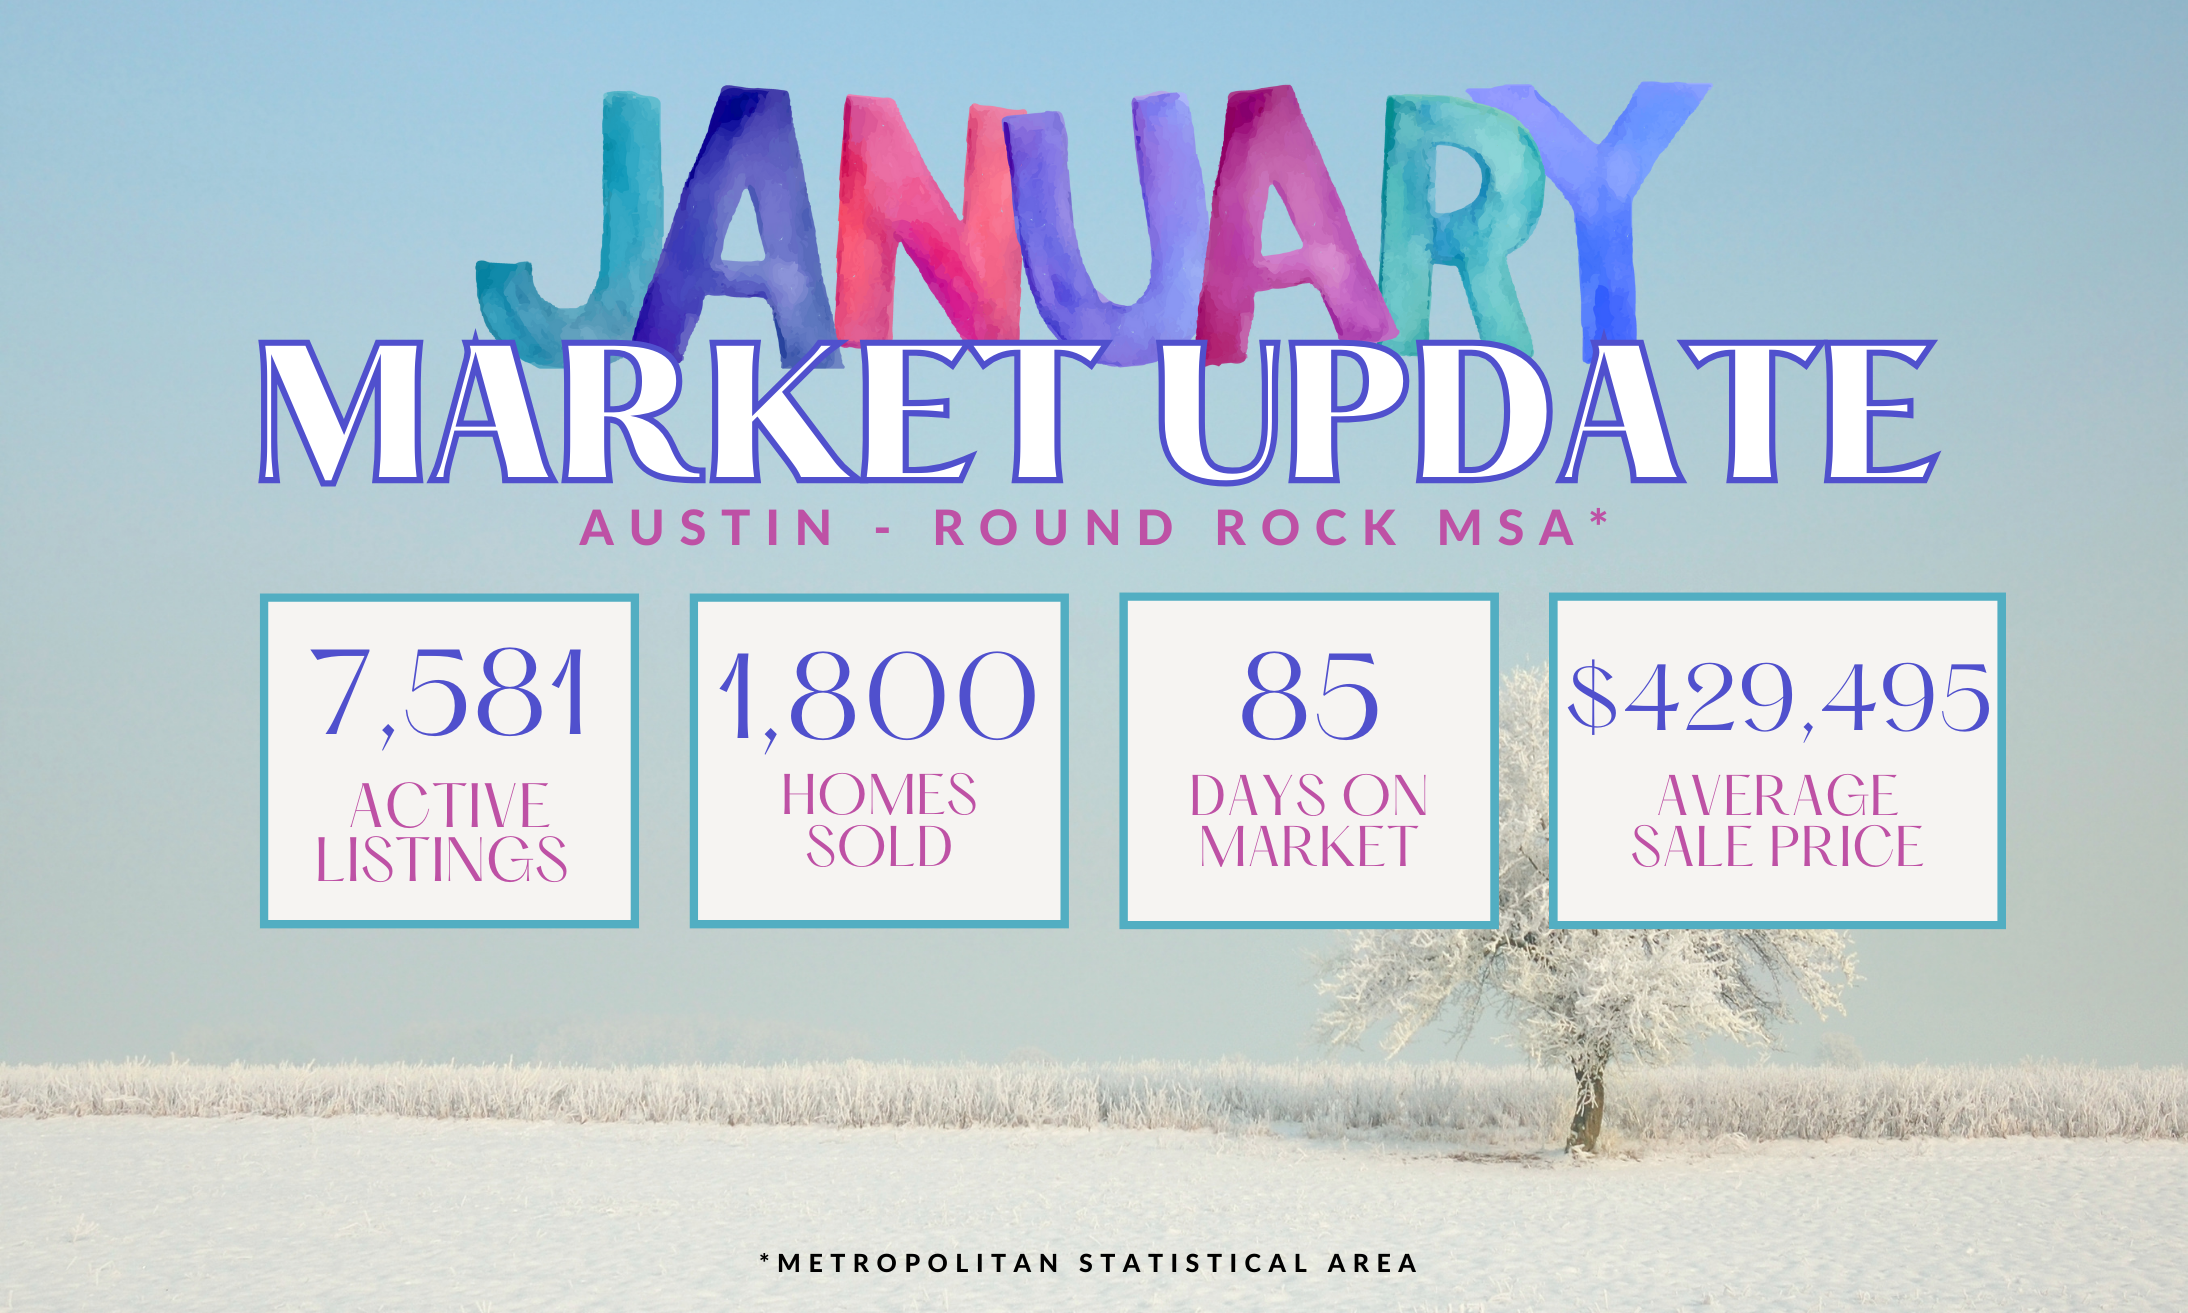
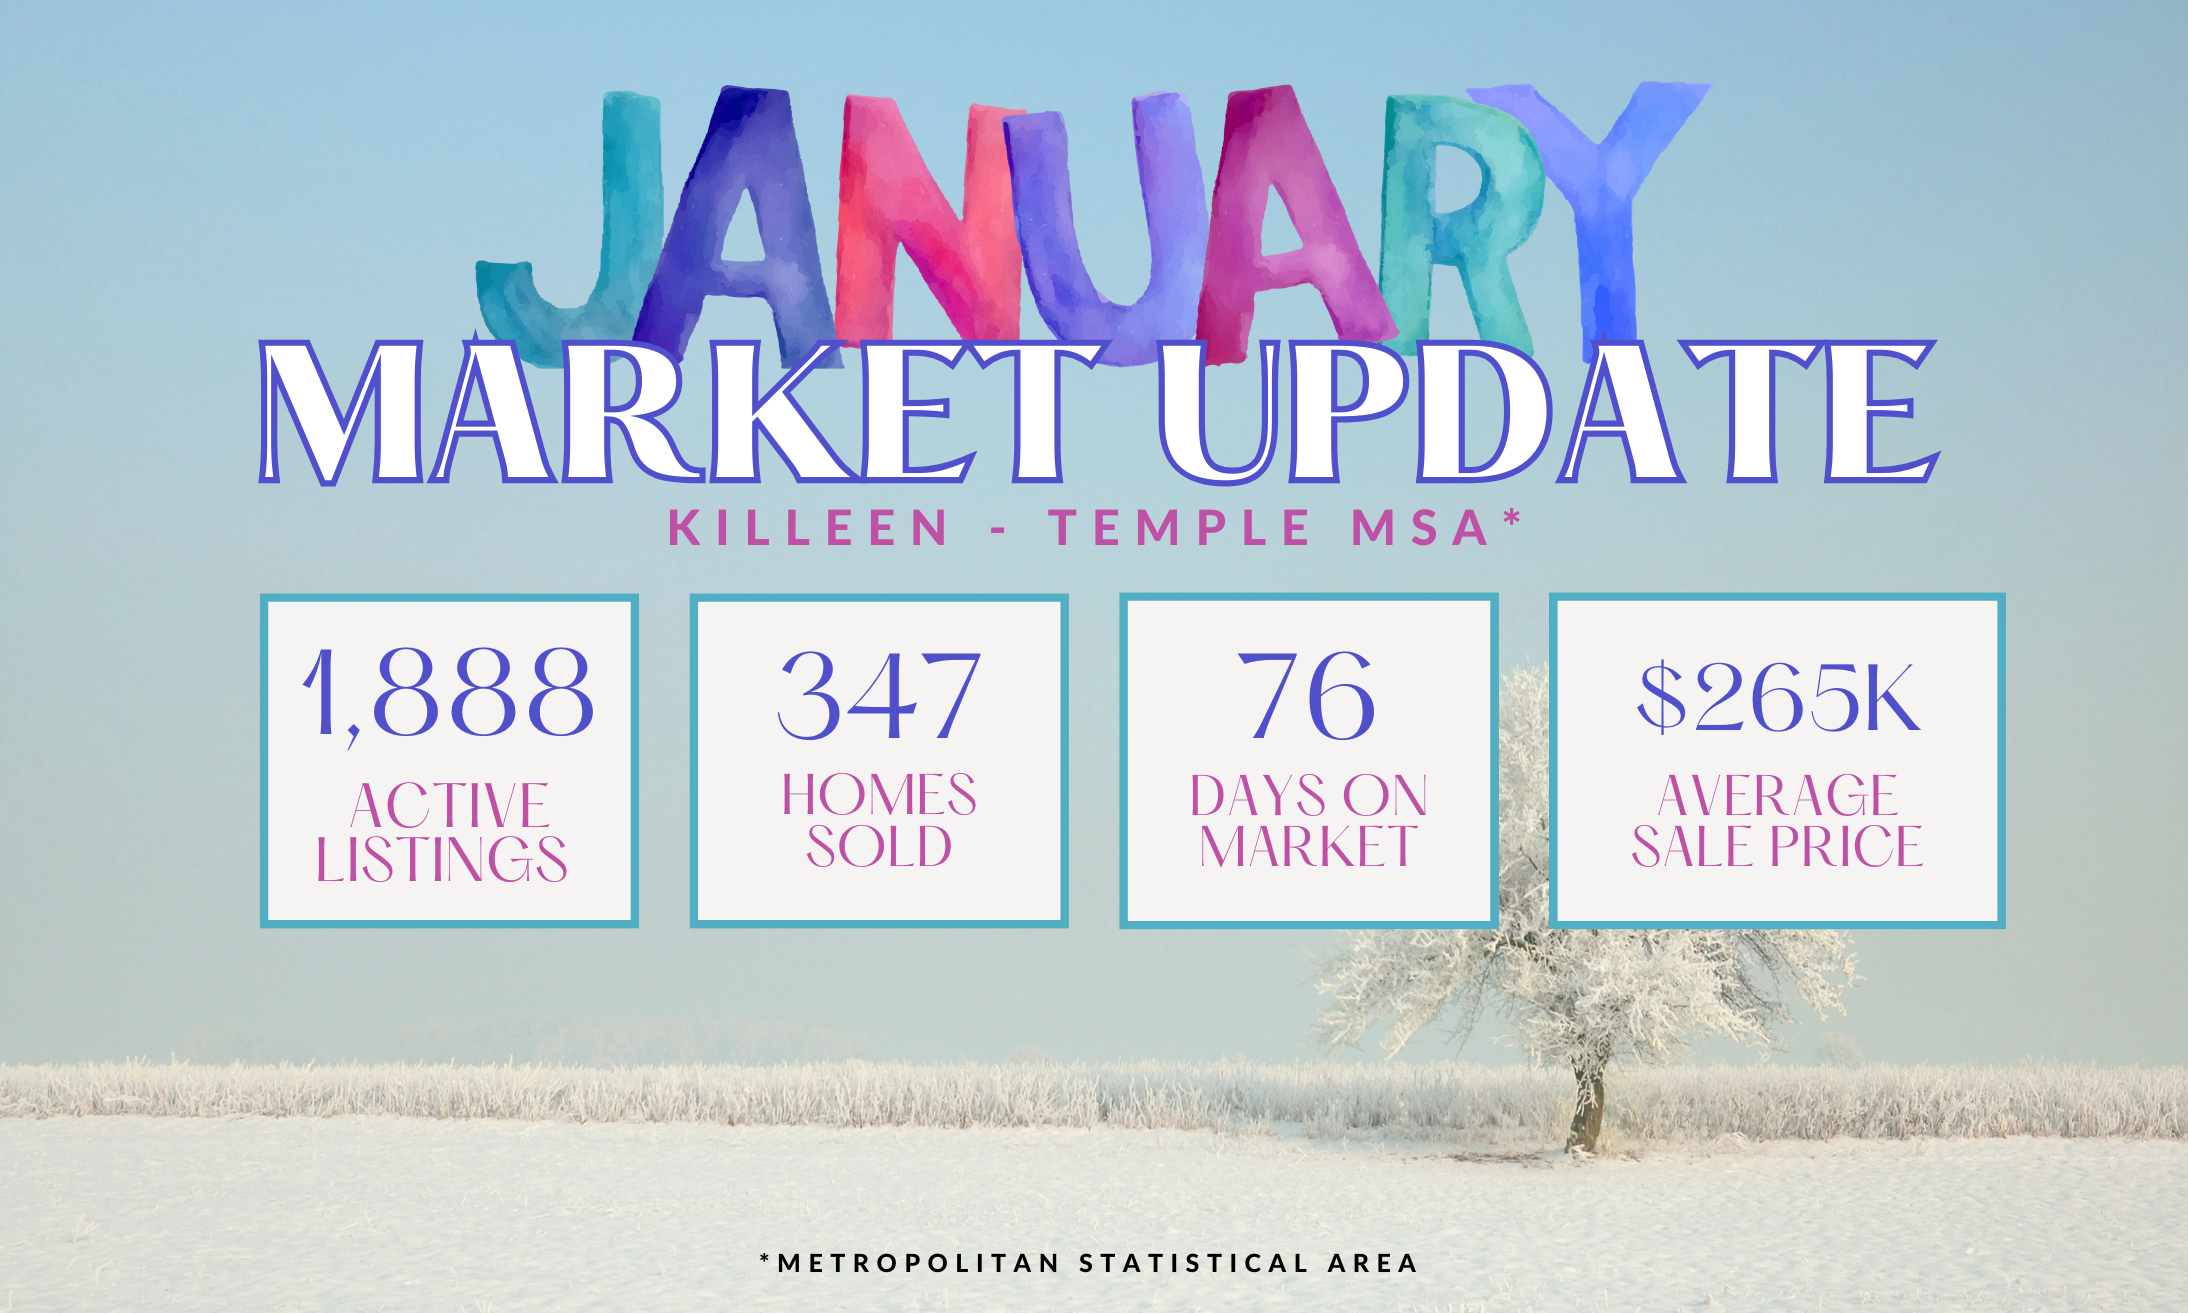
Please keep in mind this is for the entire *metropolitan statistical area. If you want zip code specific stats, I am happy to get them to you!
First up, we have the “Months Supply of Inventory,” which currently stands at 3.9. Now, what does this mean? Well, this metric tells us how many months it would take to sell all the homes on the market if no new listings were added. Essentially, it’s a measure of supply and demand. A lower number indicates a seller’s market, with limited inventory and potentially higher prices. In contrast, a higher number suggests a buyer’s market, with more options and potentially more negotiating power.
The increase in active listings has seen a 5.2% increase meaning means that the supply of homes on the market has grown slightly over the past year. For sellers, this increase might indicate a more competitive market, as more options become available to buyers. On the other hand, buyers might find this news quite exciting, as it could mean more opportunities to find their dream home.
Now, let’s talk about another crucial metric: “Median Days Homes are On the Market,” which currently stands at 68. This number tells us the average time it takes for a home to go under contract once it’s listed. It’s an essential metric for sellers, as it provides an estimate of how quickly they can expect to go under contract. For buyers, this metric can help gauge the level of competition they might face when searching for a new home. A lower number suggests a fast-paced market, while a higher number indicates a more leisurely pace. The total number of days on market sits at 105 days, with 68 days from listing to contract and 37 days from contract to close. Sellers should be prepared for this when thinking about selling their home.
Next up, we have the “List to Sold Price Percentage,” which currently sits at an impressive 93.1%. This metric reveals the percentage at which homes are selling compared to their listing price. A higher percentage indicates that homes are selling close to or even above their listing price, suggesting a strong market where sellers have the upper hand (a lower number suggesting the opposite). For buyers, this market means they need to be prepared to make competitive offers, but do have some negotiating power.
Finally, let’s talk about the “Median Sold Price,” which currently stands at a whopping $435,000. This metric reflects the middle point of all the home prices sold in a given area. It’s an essential number for both buyers and sellers. For sellers, it provides a benchmark to set realistic listing prices. For buyers, it offers insight into the overall price range of homes in the market they’re interested in (remember this is just the metropolitan area, not specific to any given area).
So, there you have it! These real estate metrics provide valuable insights into the current market conditions for both buyers and sellers. Armed with this knowledge, you can make informed decisions and navigate the exciting world of real estate with confidence. Let me know how I can help you along your home buying or selling journey!
Leave A Comment