

![]()
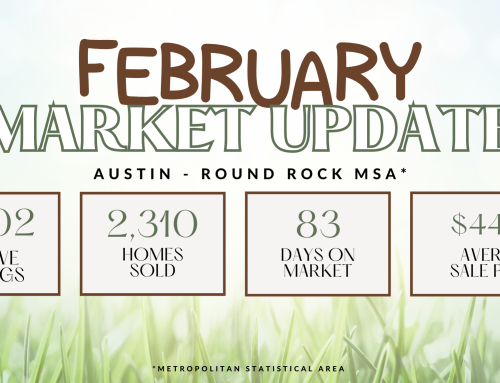
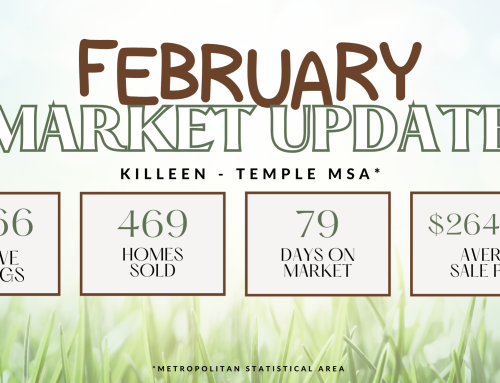
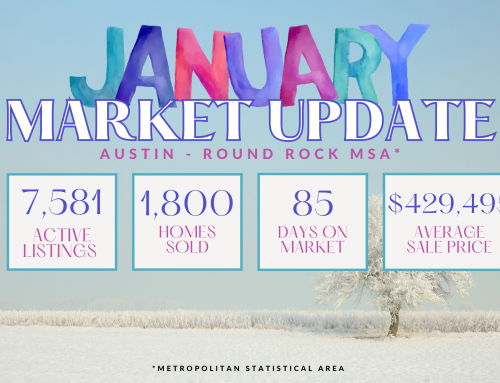
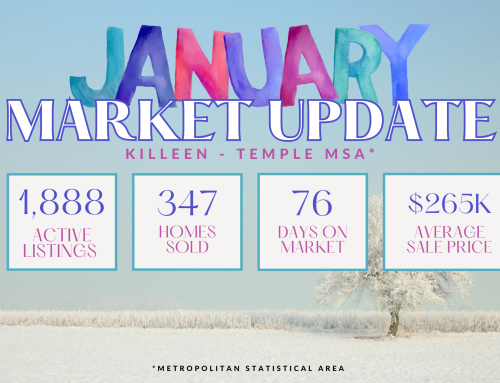
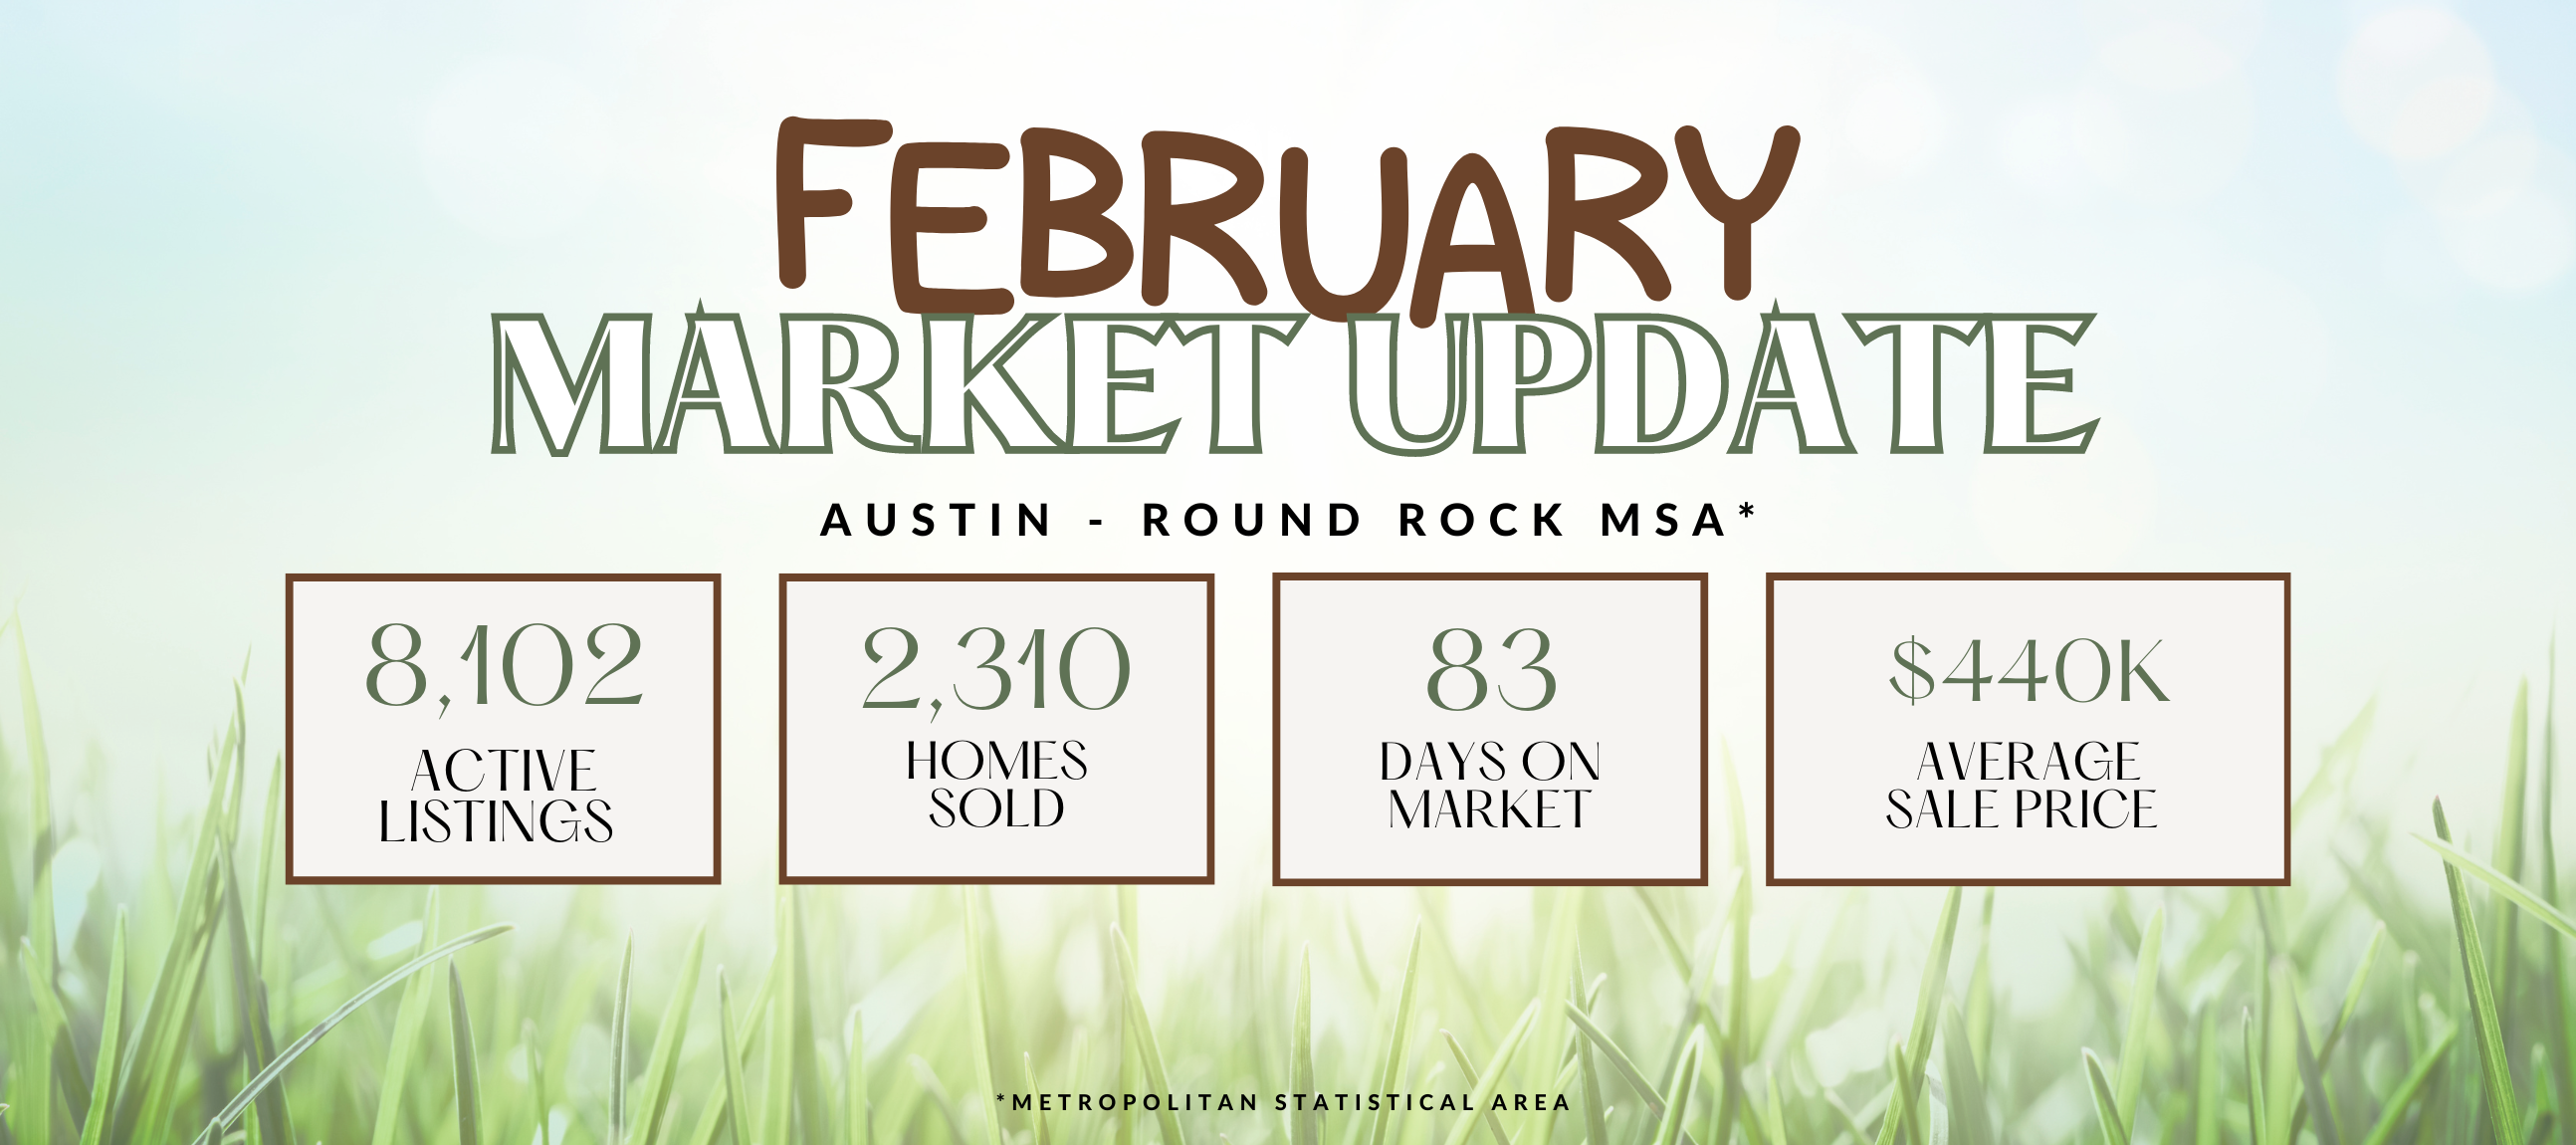
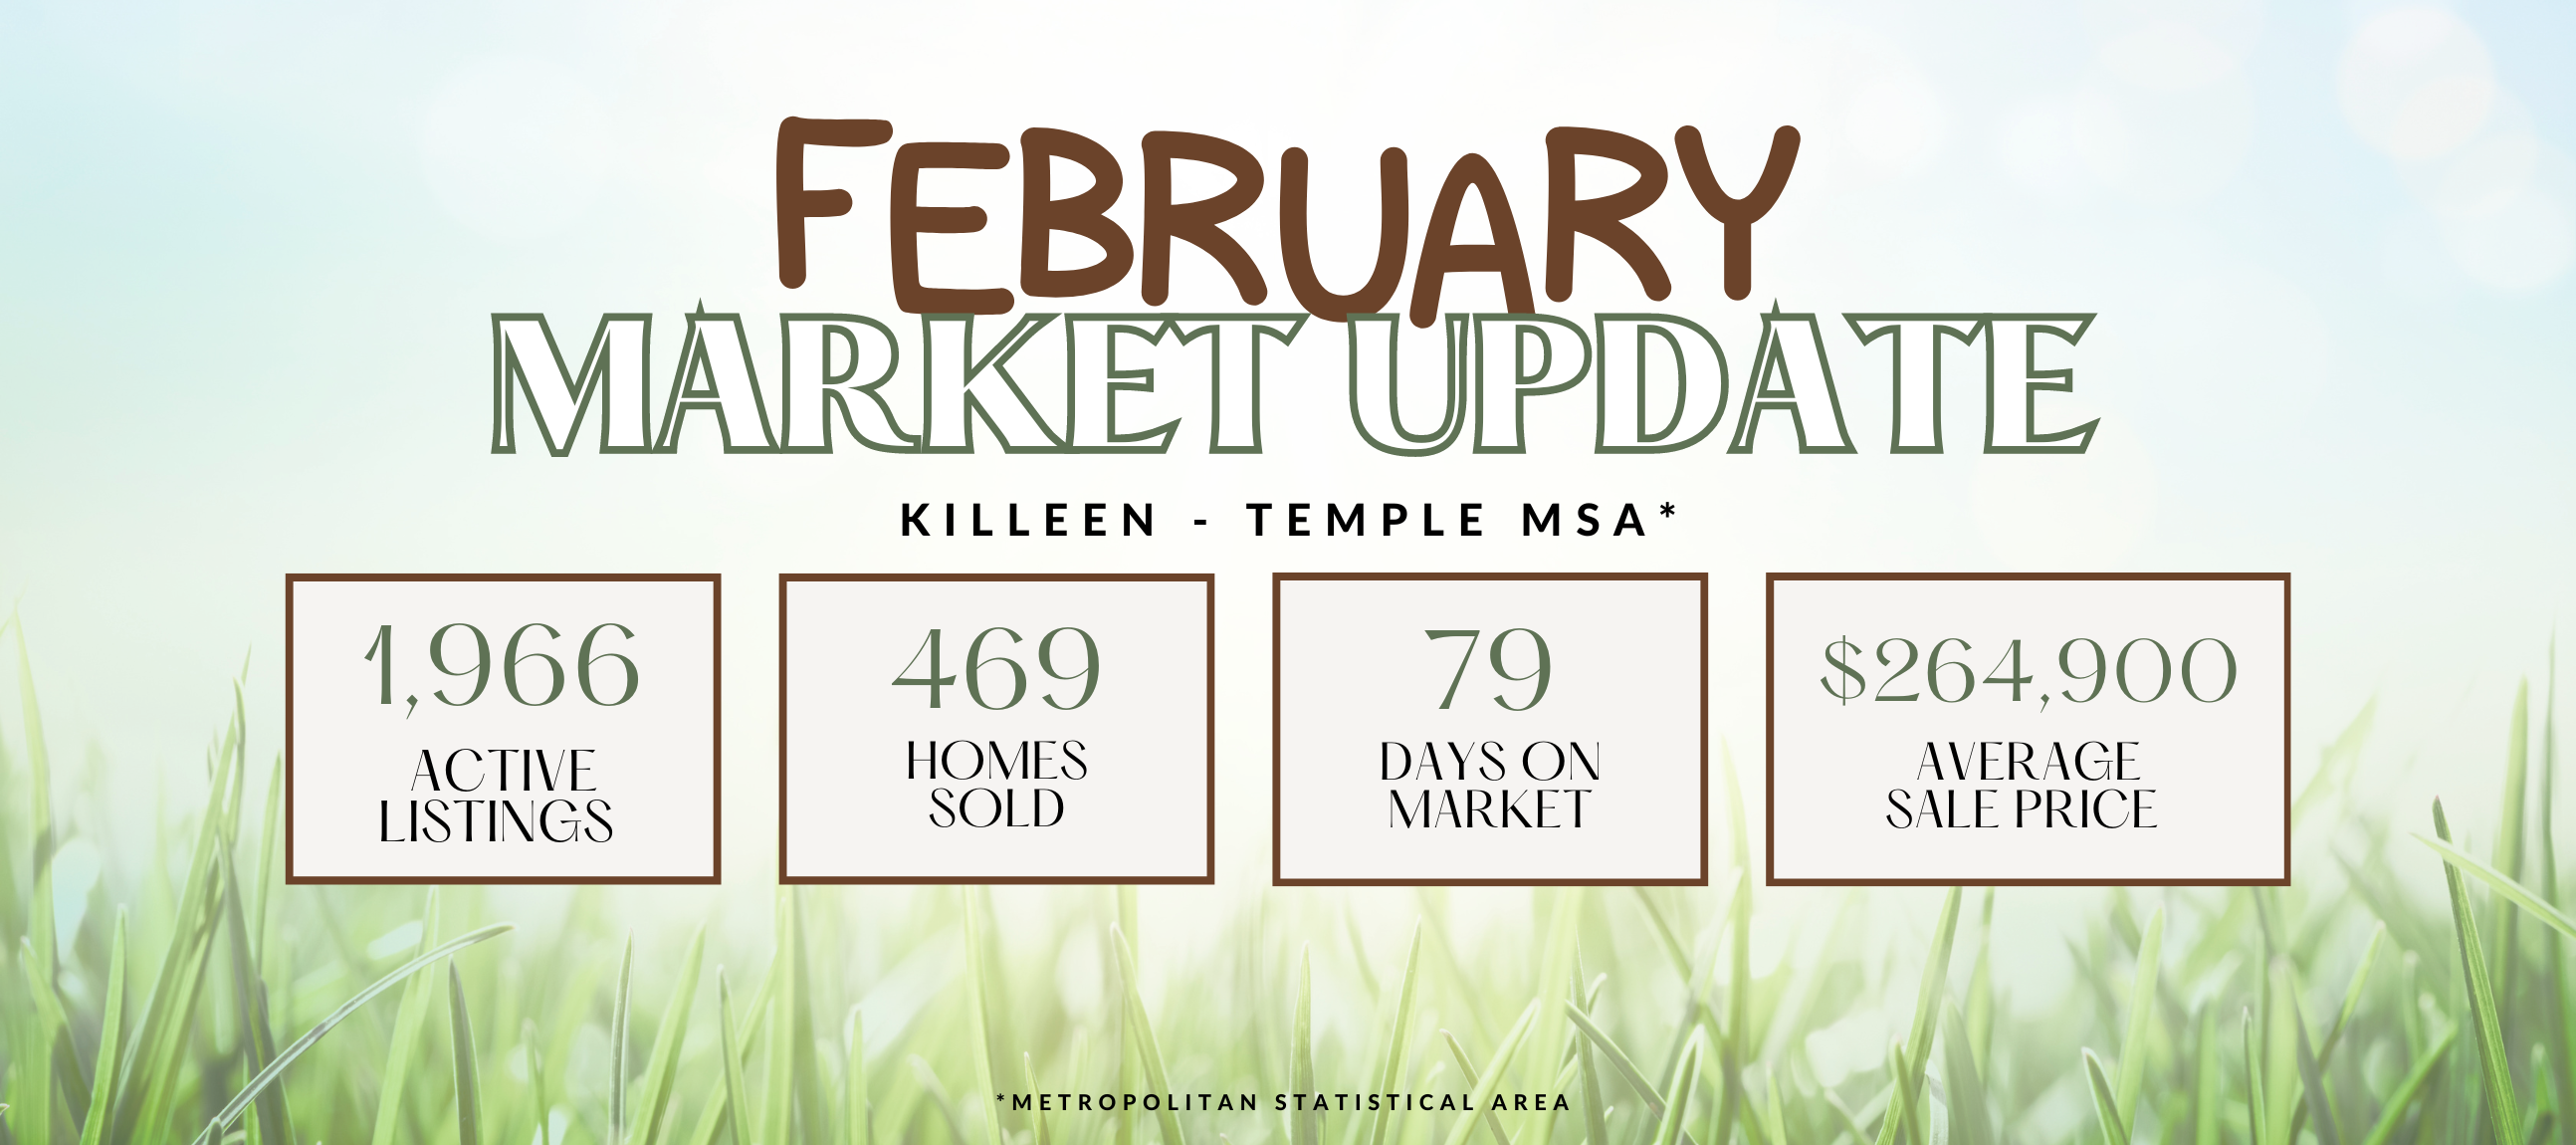
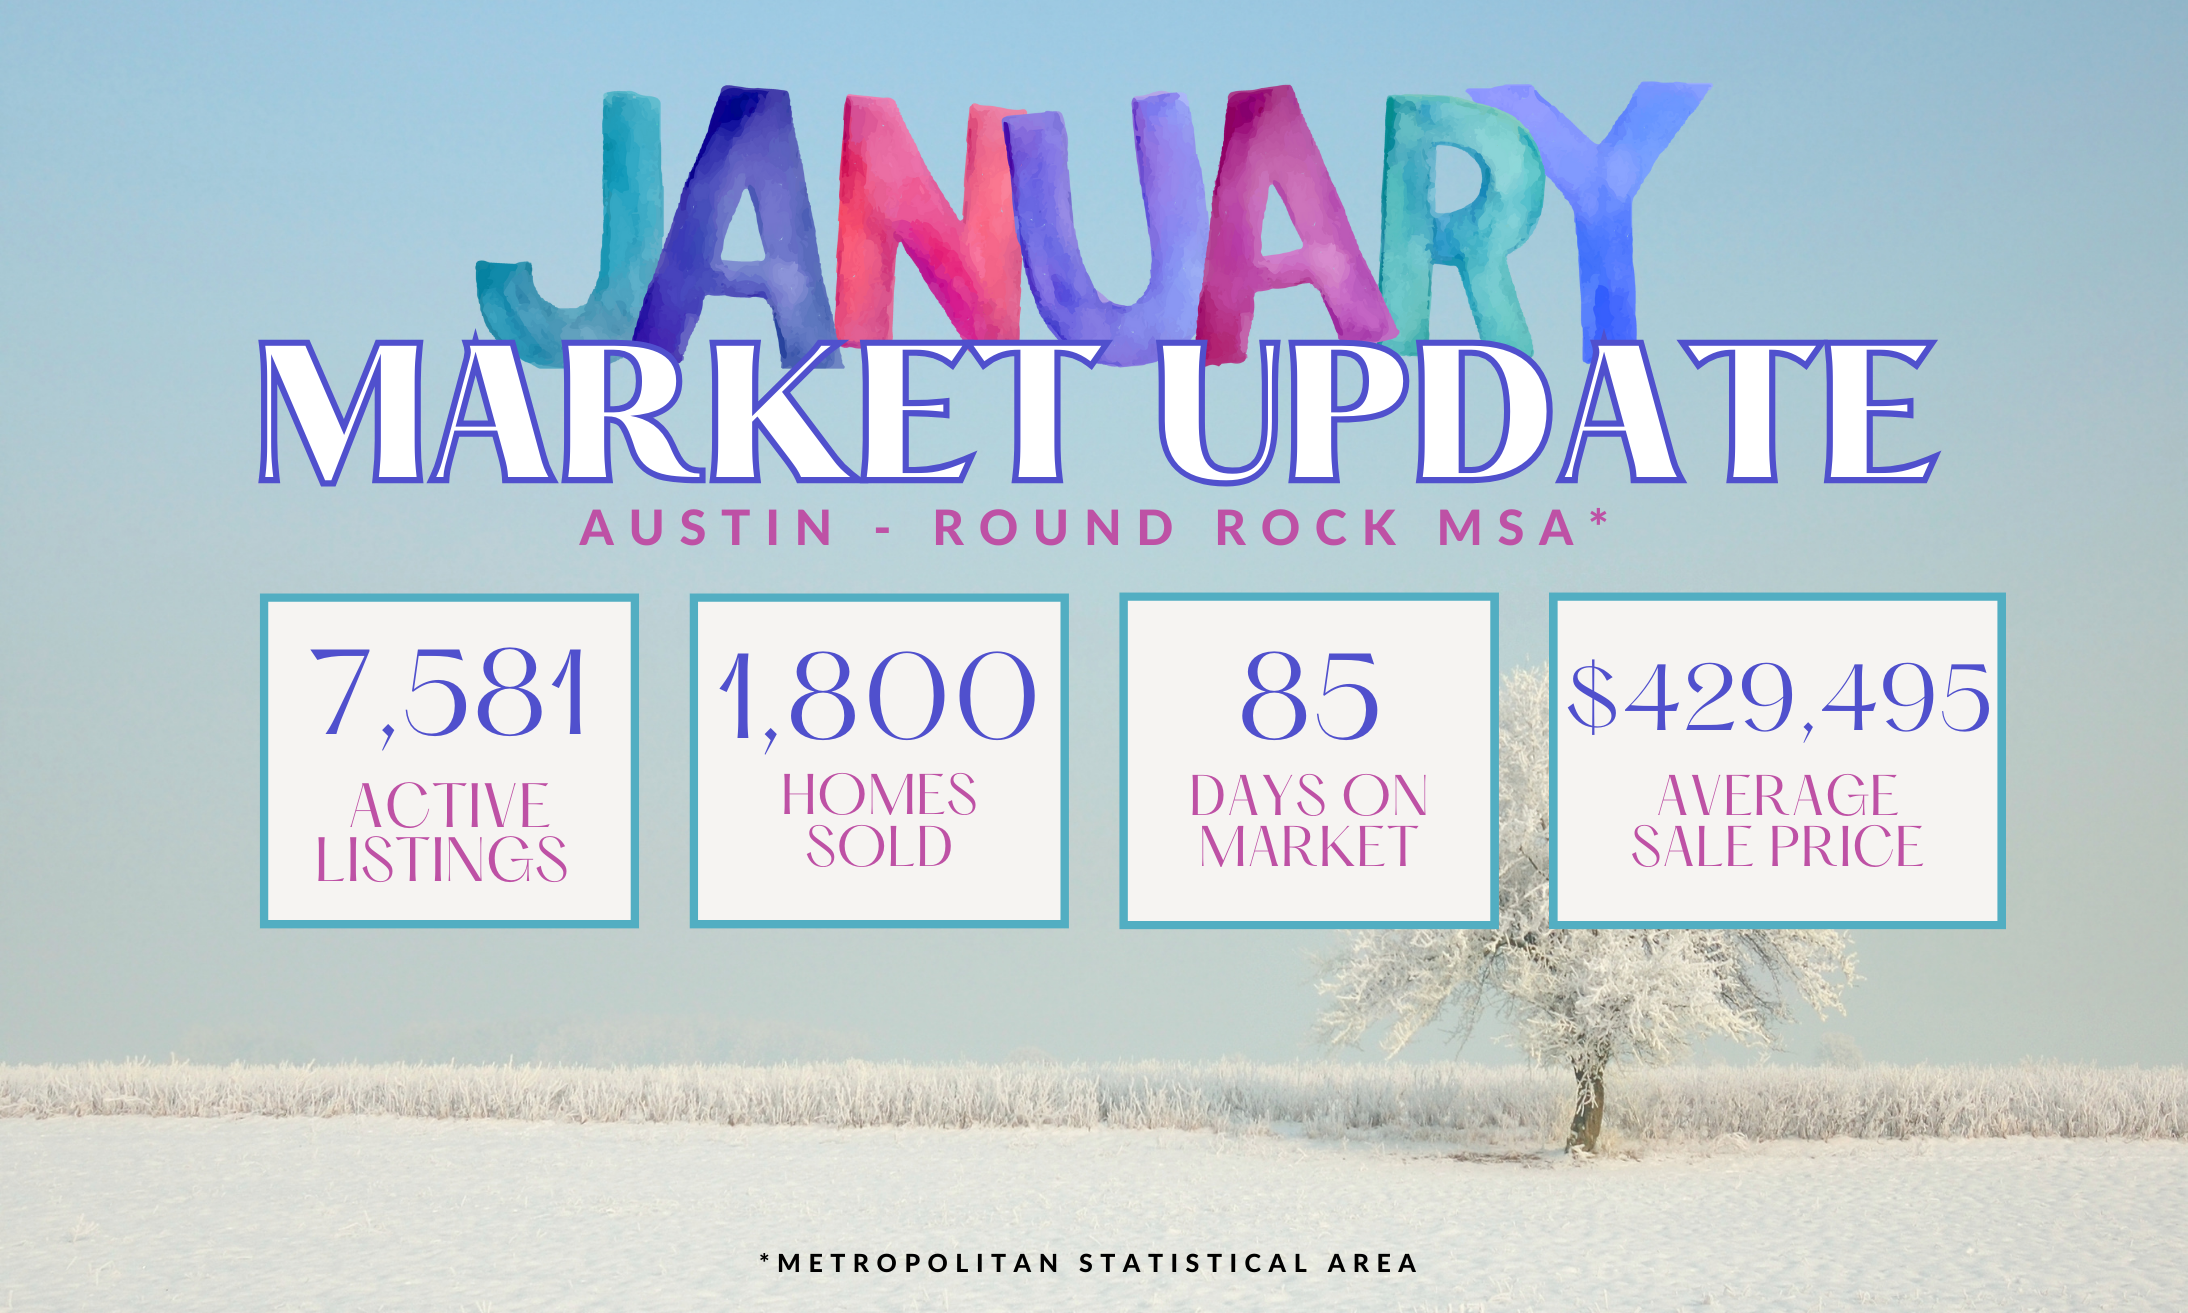
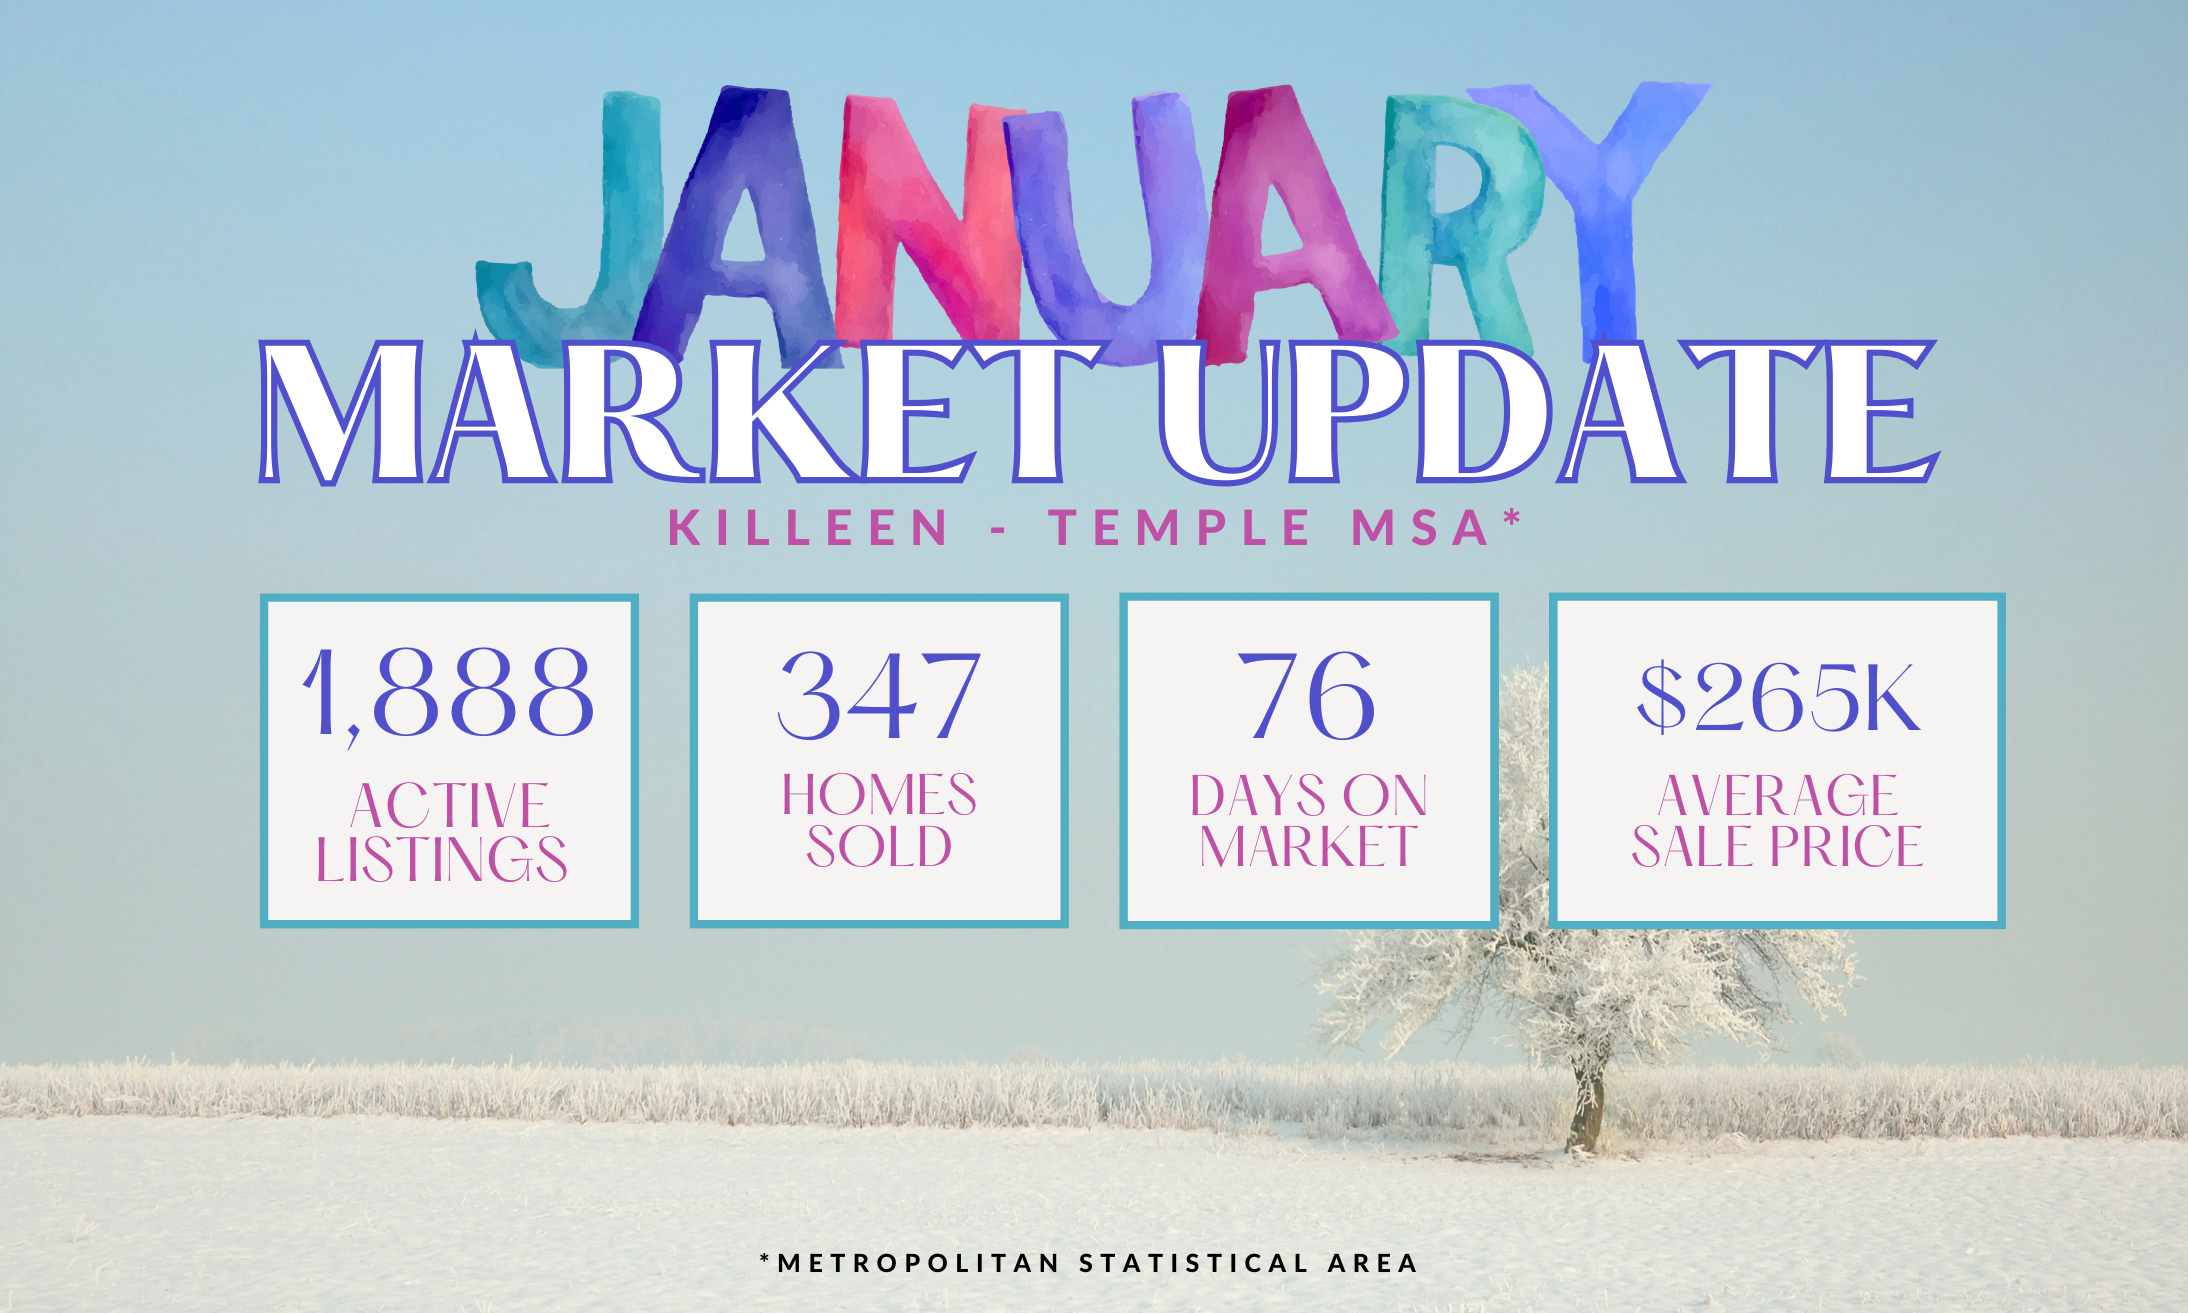
Please keep in mind this is the Metropolitan Statistical Area (MSA) for the Austin-Round Rock area. If you want specific stats relative to your zip code, please reach out so I can get them to you!
Whether you’re a buyer or a seller, the information contained in the infographic above is crucial in navigating the ever-changing real estate market. So, let’s jump right in!
First up, we have the Months Supply of Inventory, which currently stands at 3.7. This metric represents the number of months it would take to sell all the homes on the market if no new listings were added. A lower number indicates a seller’s market, where demand is high and supply is limited. In this case, a 3.7-month supply suggests a relatively balanced market, providing both buyers and sellers with opportunities.
Now, let’s look at the 12-Month Change in Months of Inventory, which shows a positive trend of +7.2%. This means that the supply of homes has increased over the past year. While this may seem like good news for buyers, it also indicates a potential shift towards a buyer’s market, where there is more supply than demand. Sellers should be aware of this trend and adjust their pricing and marketing strategies accordingly.
Moving on, we have the Median Days Homes are On the Market, which currently sits at 75. This metric measures the average number of days it takes for a home to sell. A lower number suggests a faster-moving market, indicating strong demand. With homes spending 75 days on the market, it shows that while buyers are actively searching for properties, the days sellers have their properties on the market for is over 2 months. This is important to keep in mind when listing your house and your specific time-frame for selling your home!
Lastly, we have the Median Sold Price, which stands at $424,450.00. This represents the middle point of all the sold prices in a the Austin-Round Rock MSA area. A higher median sold price indicates a more expensive market, potentially attracting higher-end buyers. For sellers, this means there is an opportunity to fetch a good price for their properties. Again, keep in mind this is for the entire area and not specific to zip code. The numbers will change depending on city and zip code (for example the median price in the city of Austin is much higher).
In conclusion, these real estate metrics provide valuable insights for both buyers and sellers. With a balanced supply of inventory, an increasing trend in supply, a bit longer time on the market, and a healthy median sold price, the market may be favorable for both parties. Buyers can find opportunities while sellers can still potentially secure a fair price for their homes. So, whether you’re looking to buy or sell, now is a great time to dive into the real estate market!
Leave A Comment