

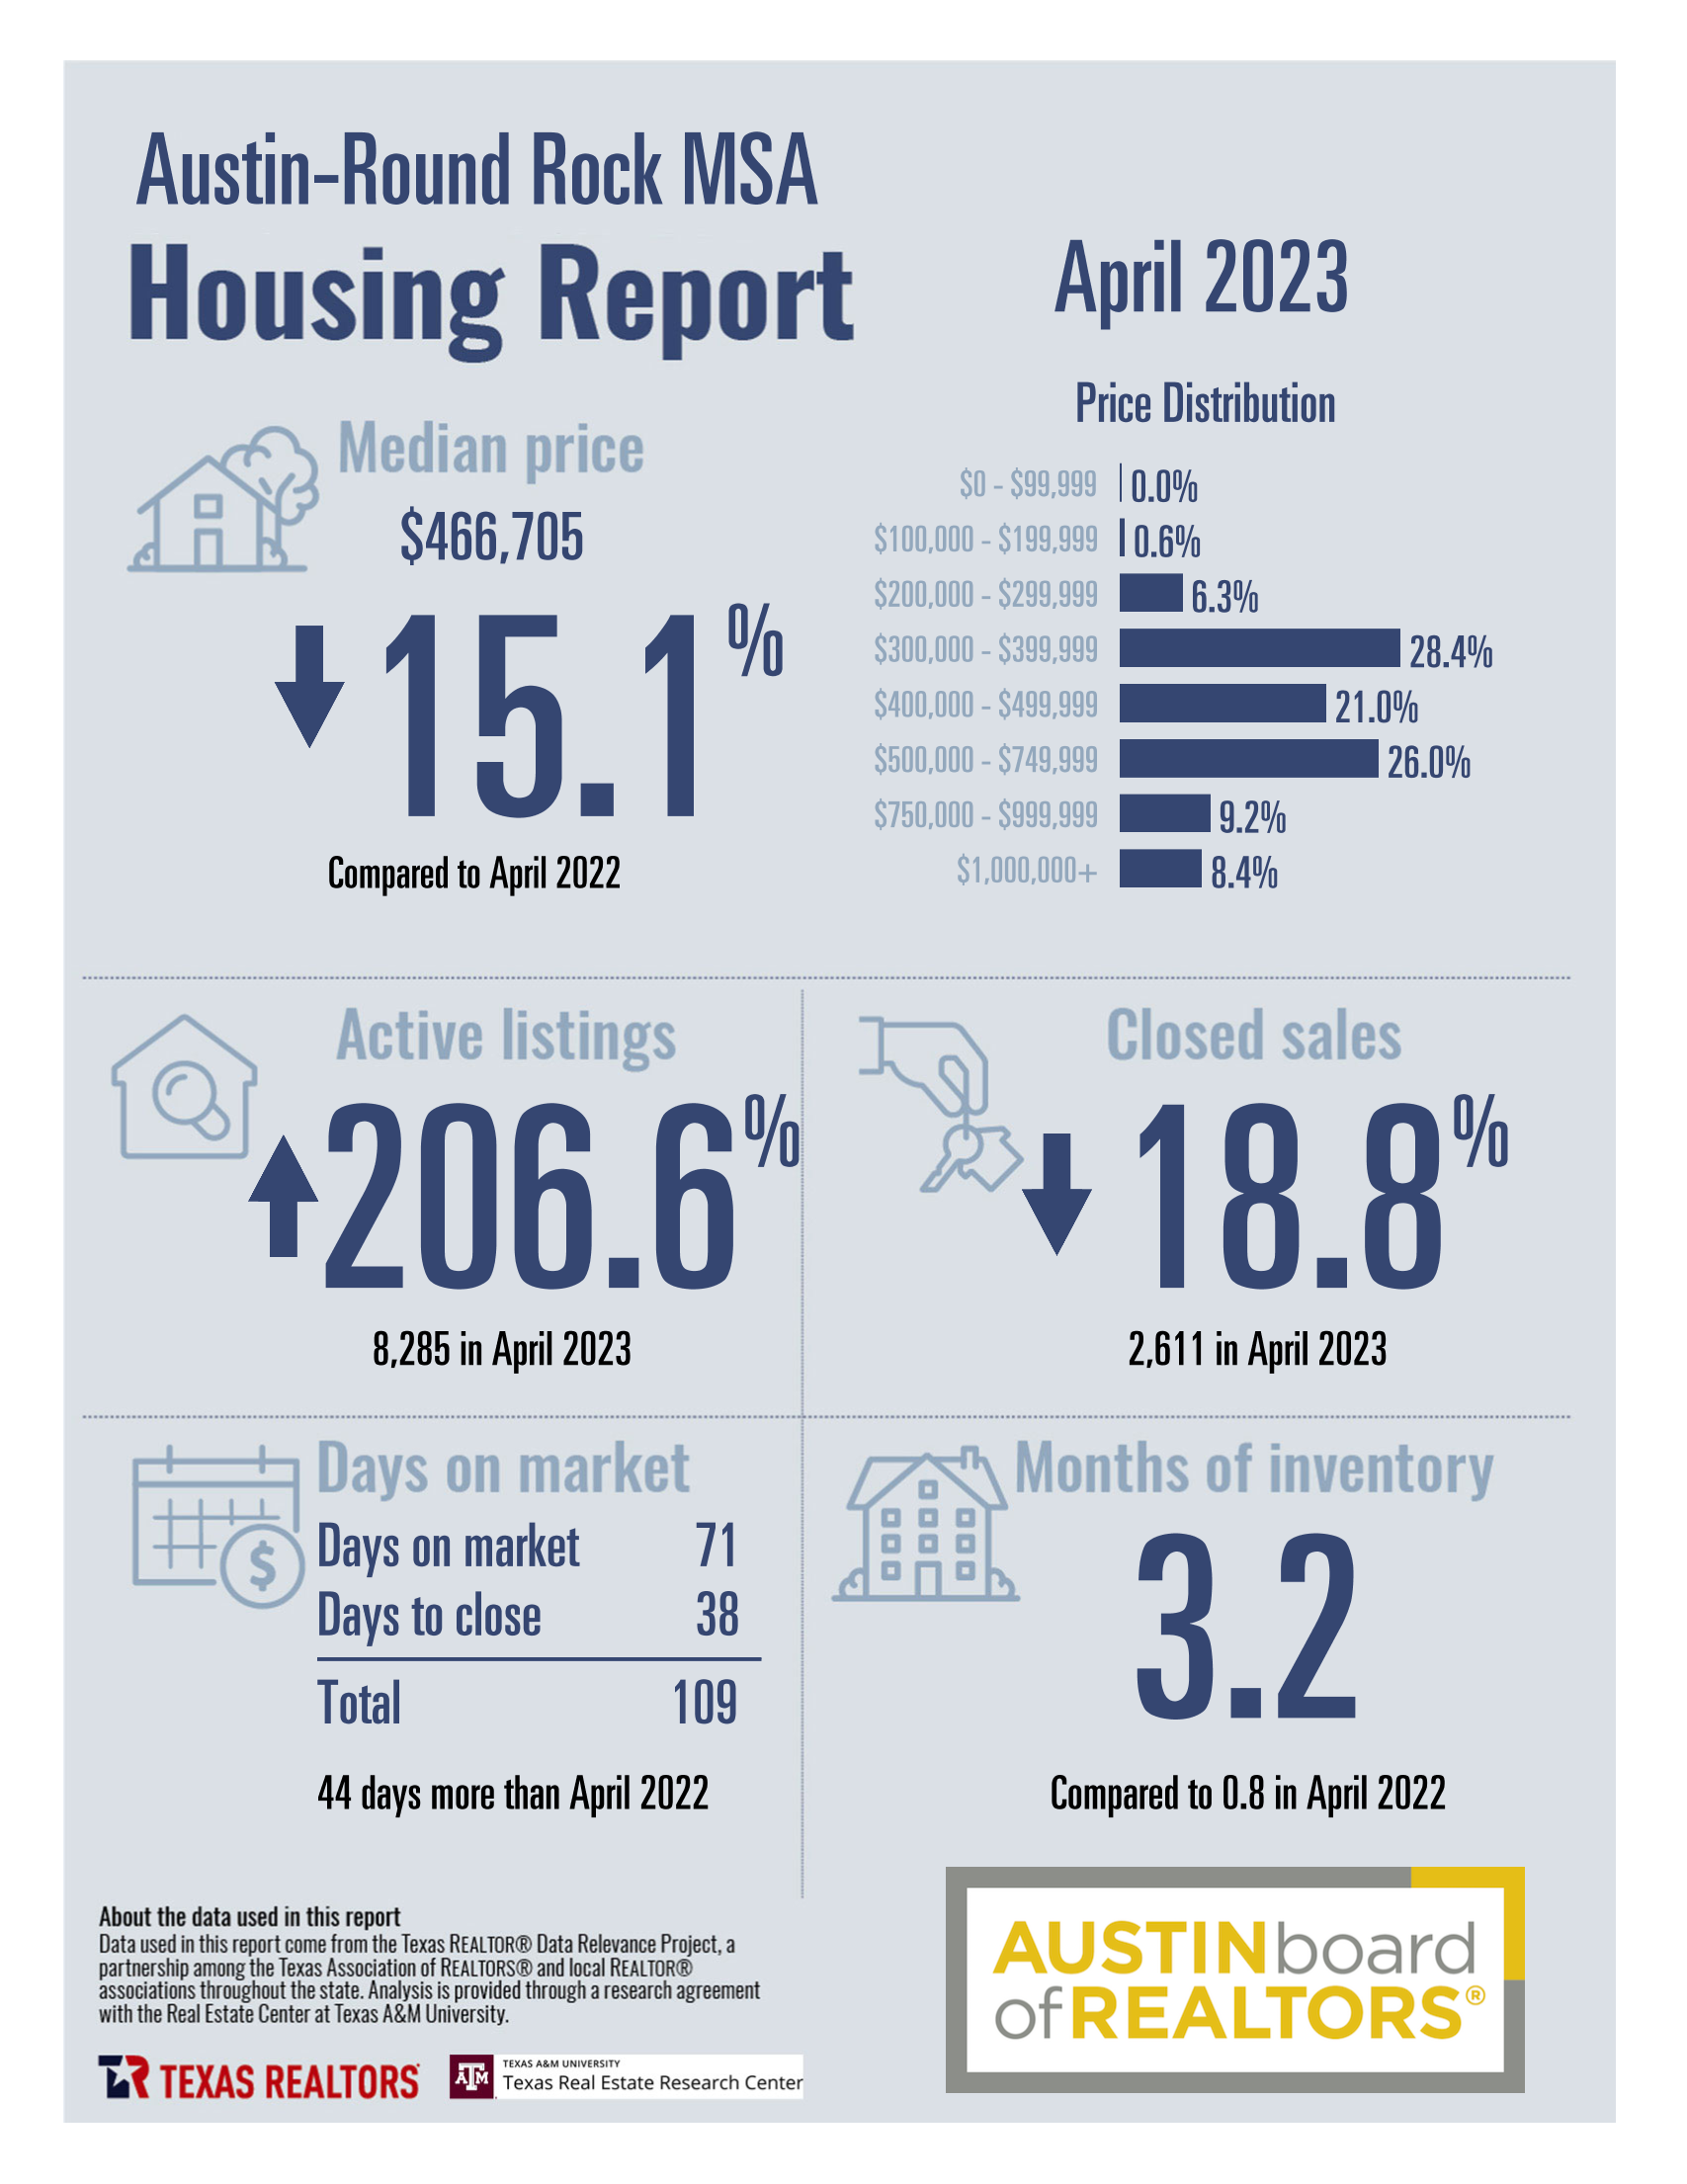
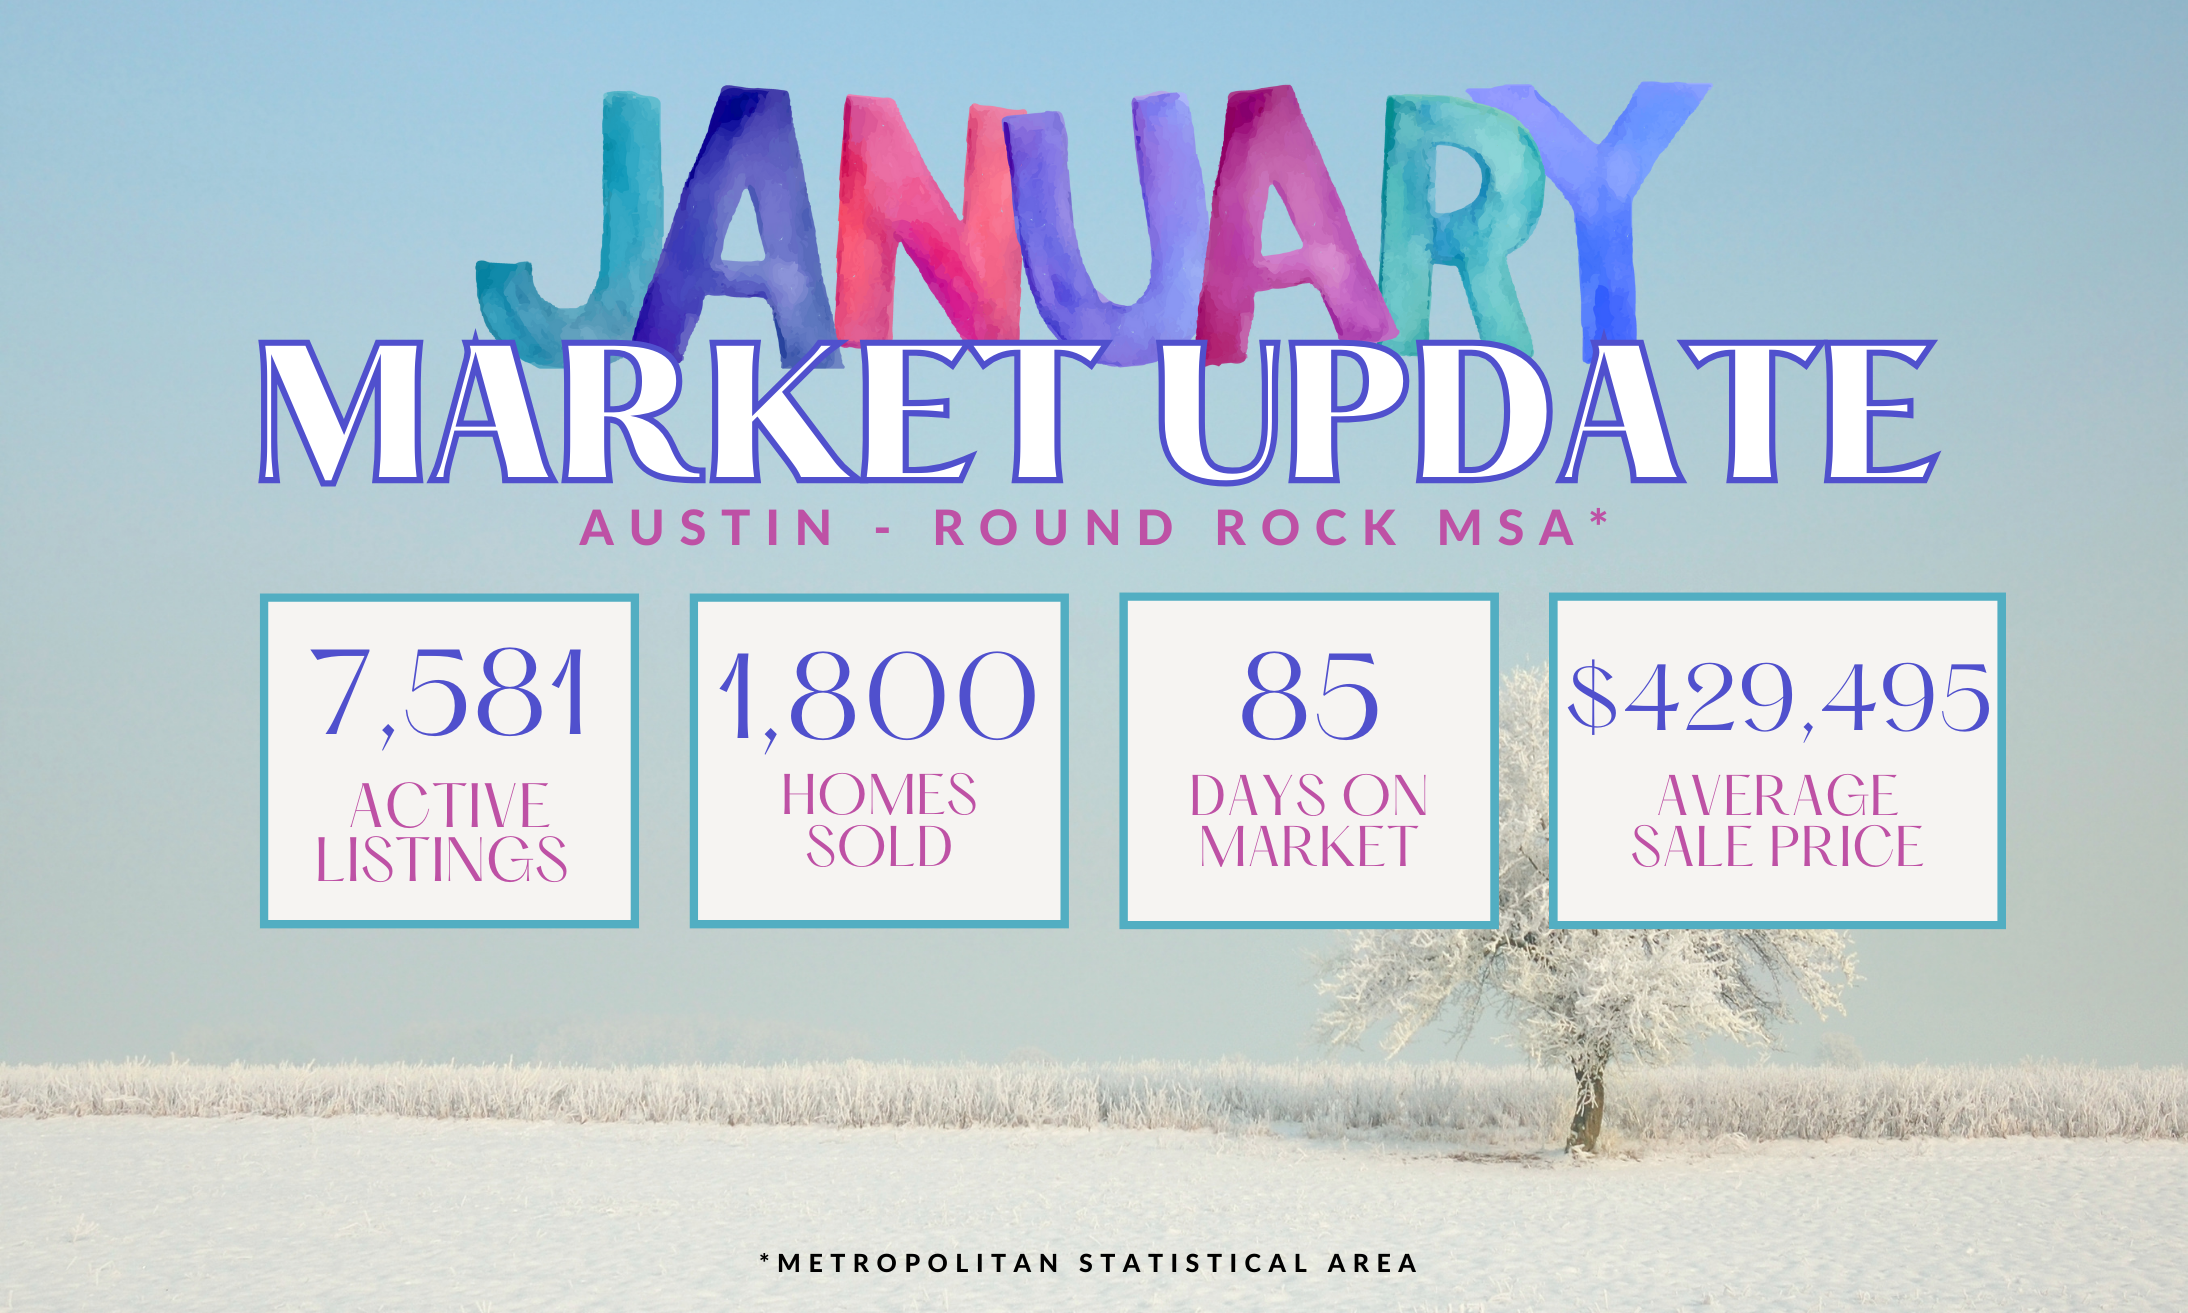
Staying informed about the latest housing market trends is essential for home owners, sellers, and buyers! Here you can see the Texas REALTORS® snapshot of the April housing market report for the Austin-Round Rock Metropolitan Area. It provides key metrics such as active listings, closed sales, median house price, and days on market. By understanding these numbers, you can gain valuable insights into the current state of the local Austin housing market and make more informed decisions.
- Active Listings: The number of active listings represents the total properties available for sale during a specific period. In the April housing market report, we observed an increase in active listings compared to the previous month. The number of active listings rose from 8,059 in March to 8,285 in April. This indicates an expanding inventory, providing buyers with a wider range of options to choose from. Sellers should be mindful of pricing their properties competitively and highlighting unique features to attract buyers in this market with increased active listings.
- Closed Sales: Closed sales represent the number of properties that have successfully completed the transaction process during the specified timeframe. However, in the April housing market report, closed sales showed a decrease compared to the previous month. The number of closed sales dropped from 2,804 in March to 2,611 in April. This decline suggests a slight slowdown in buyer activity and demand in the market. Sellers may need to adjust their pricing strategies and consider other incentives to attract potential buyers. On the other hand, buyers may have more negotiating power and a wider selection of properties to choose from.
- Median House Price: The median house price provides an important measure of the average cost of homes sold in a the Austin Metro area. In the April housing market report, the median house price experienced an increase compared to the previous month. The median house price rose from $450,000 in March to $466,705 in April. This rise in median price indicates a growing demand and potentially limited housing supply in the local market. Buyers should be prepared for competitive pricing and consider their budget accordingly, while sellers may benefit from the upward price trend.
- Days on Market: Days on market (DOM) refers to the average number of days it takes for a property to sell after being listed. In the April housing market report, the average DOM decreased compared to the previous month. The average days on market decreased from 80 days in March to 71 days in April. This decline suggests a faster-paced market, with properties selling at a quicker rate despite higher median home prices.
The April housing market report provides insights into the local real estate landscape, demonstrating some unique dynamics. By staying informed about these metrics, buyers, sellers, and investors can make more informed decisions and adjust their strategies accordingly. Armed with the knowledge from the market report, you can navigate the local housing market more effectively, whether you’re looking to buy, sell, or invest in properties.
*Remember that real estate markets can vary significantly from one location to another, so it’s advisable to consult local market experts or real estate professionals for precise and up-to-date information specific to your desired area.
Leave A Comment