

![]()
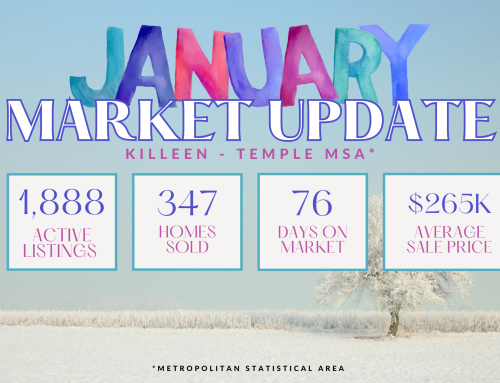
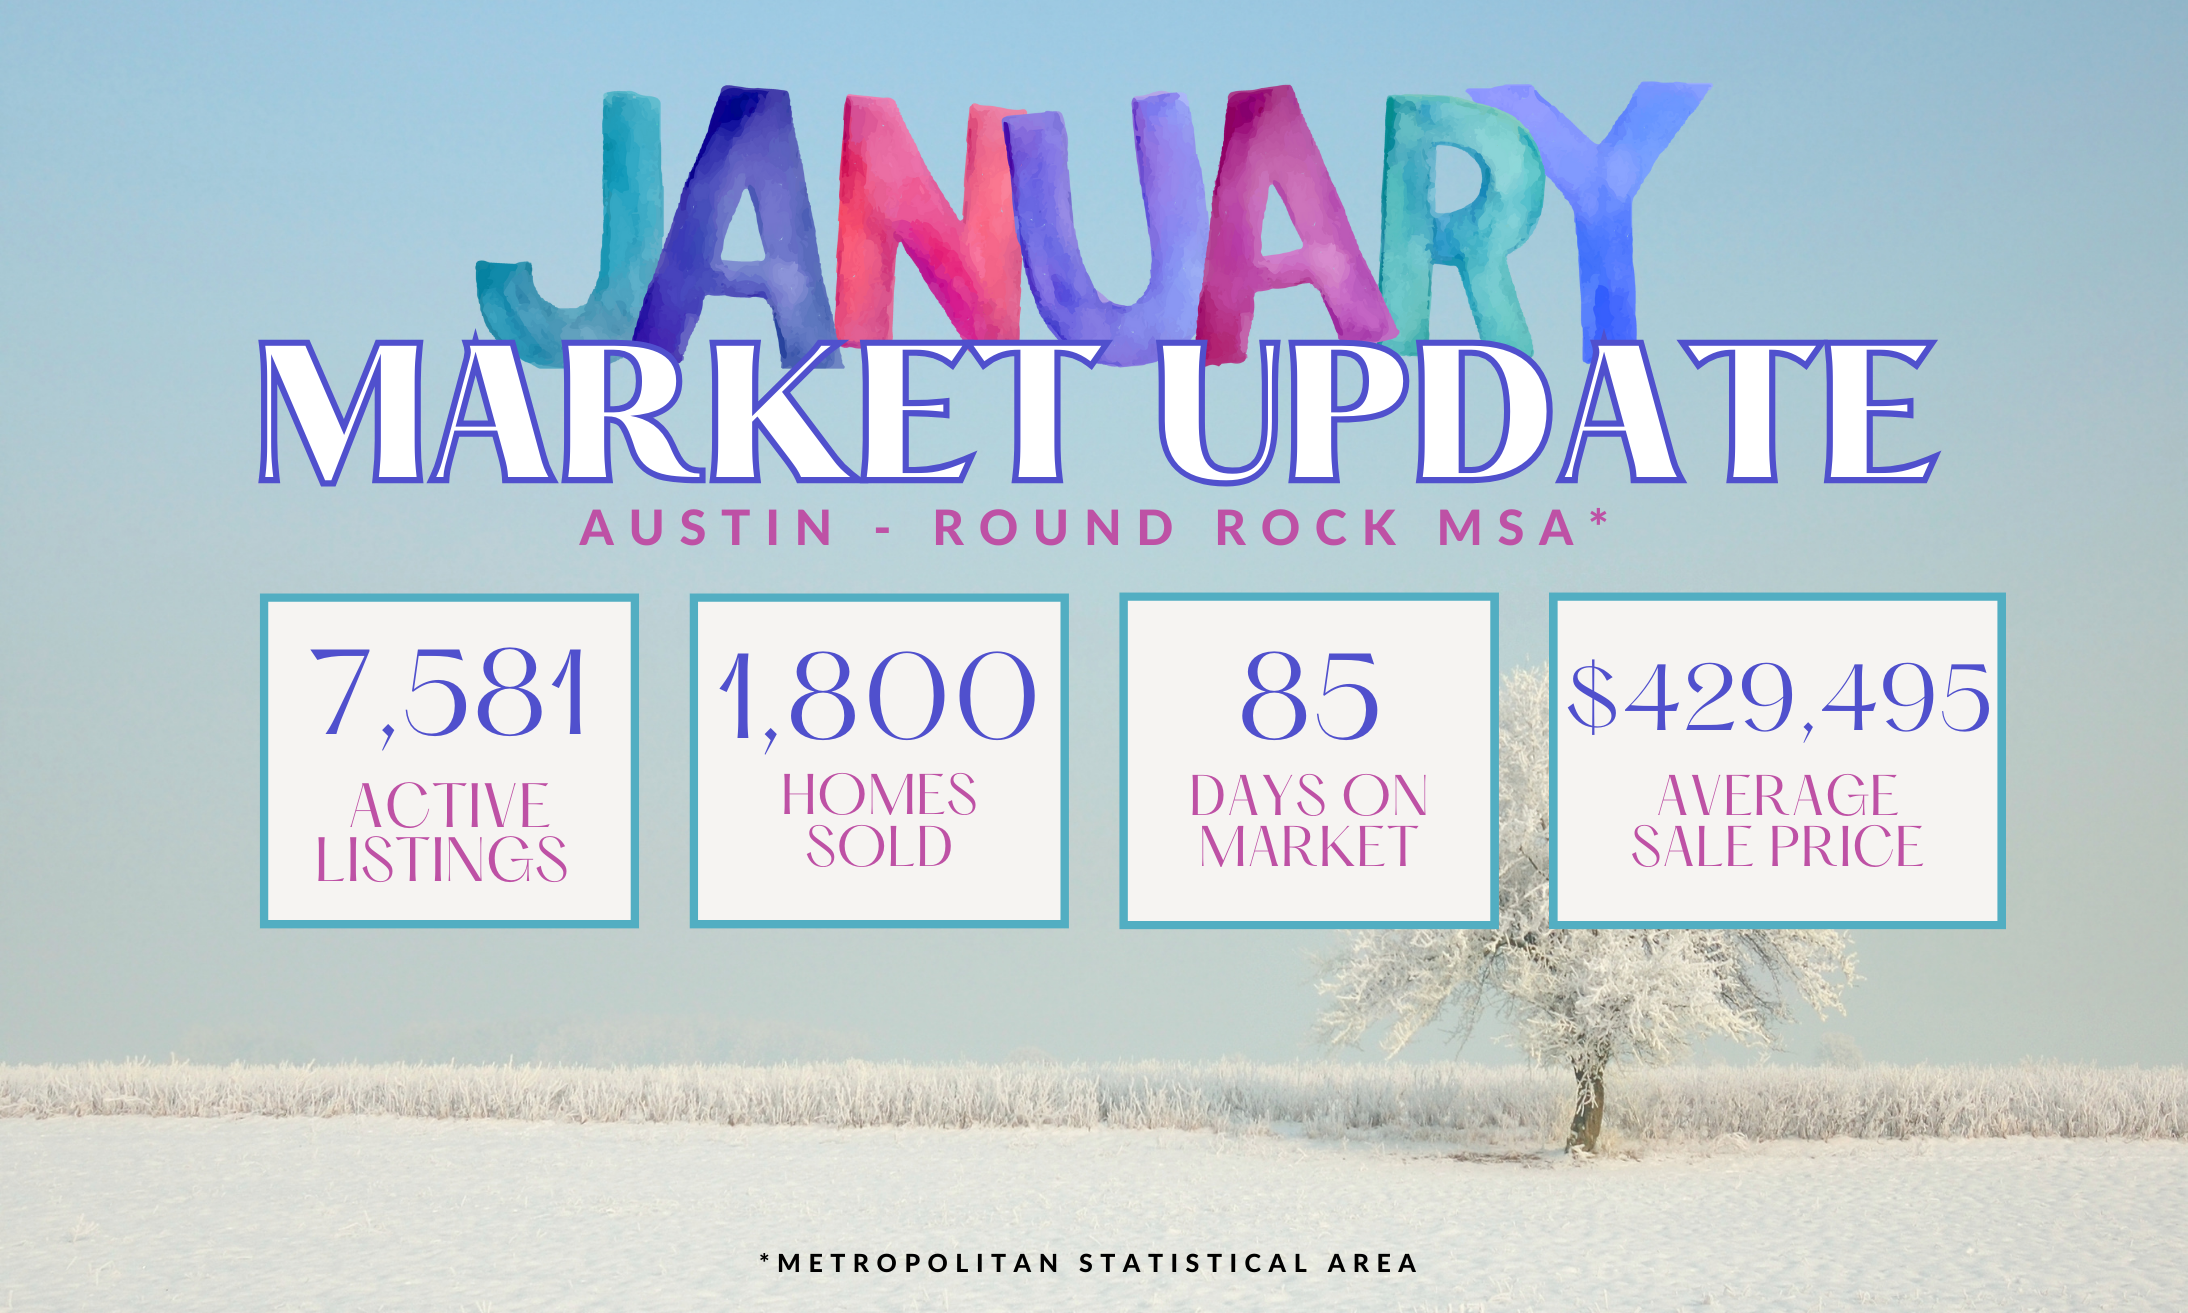
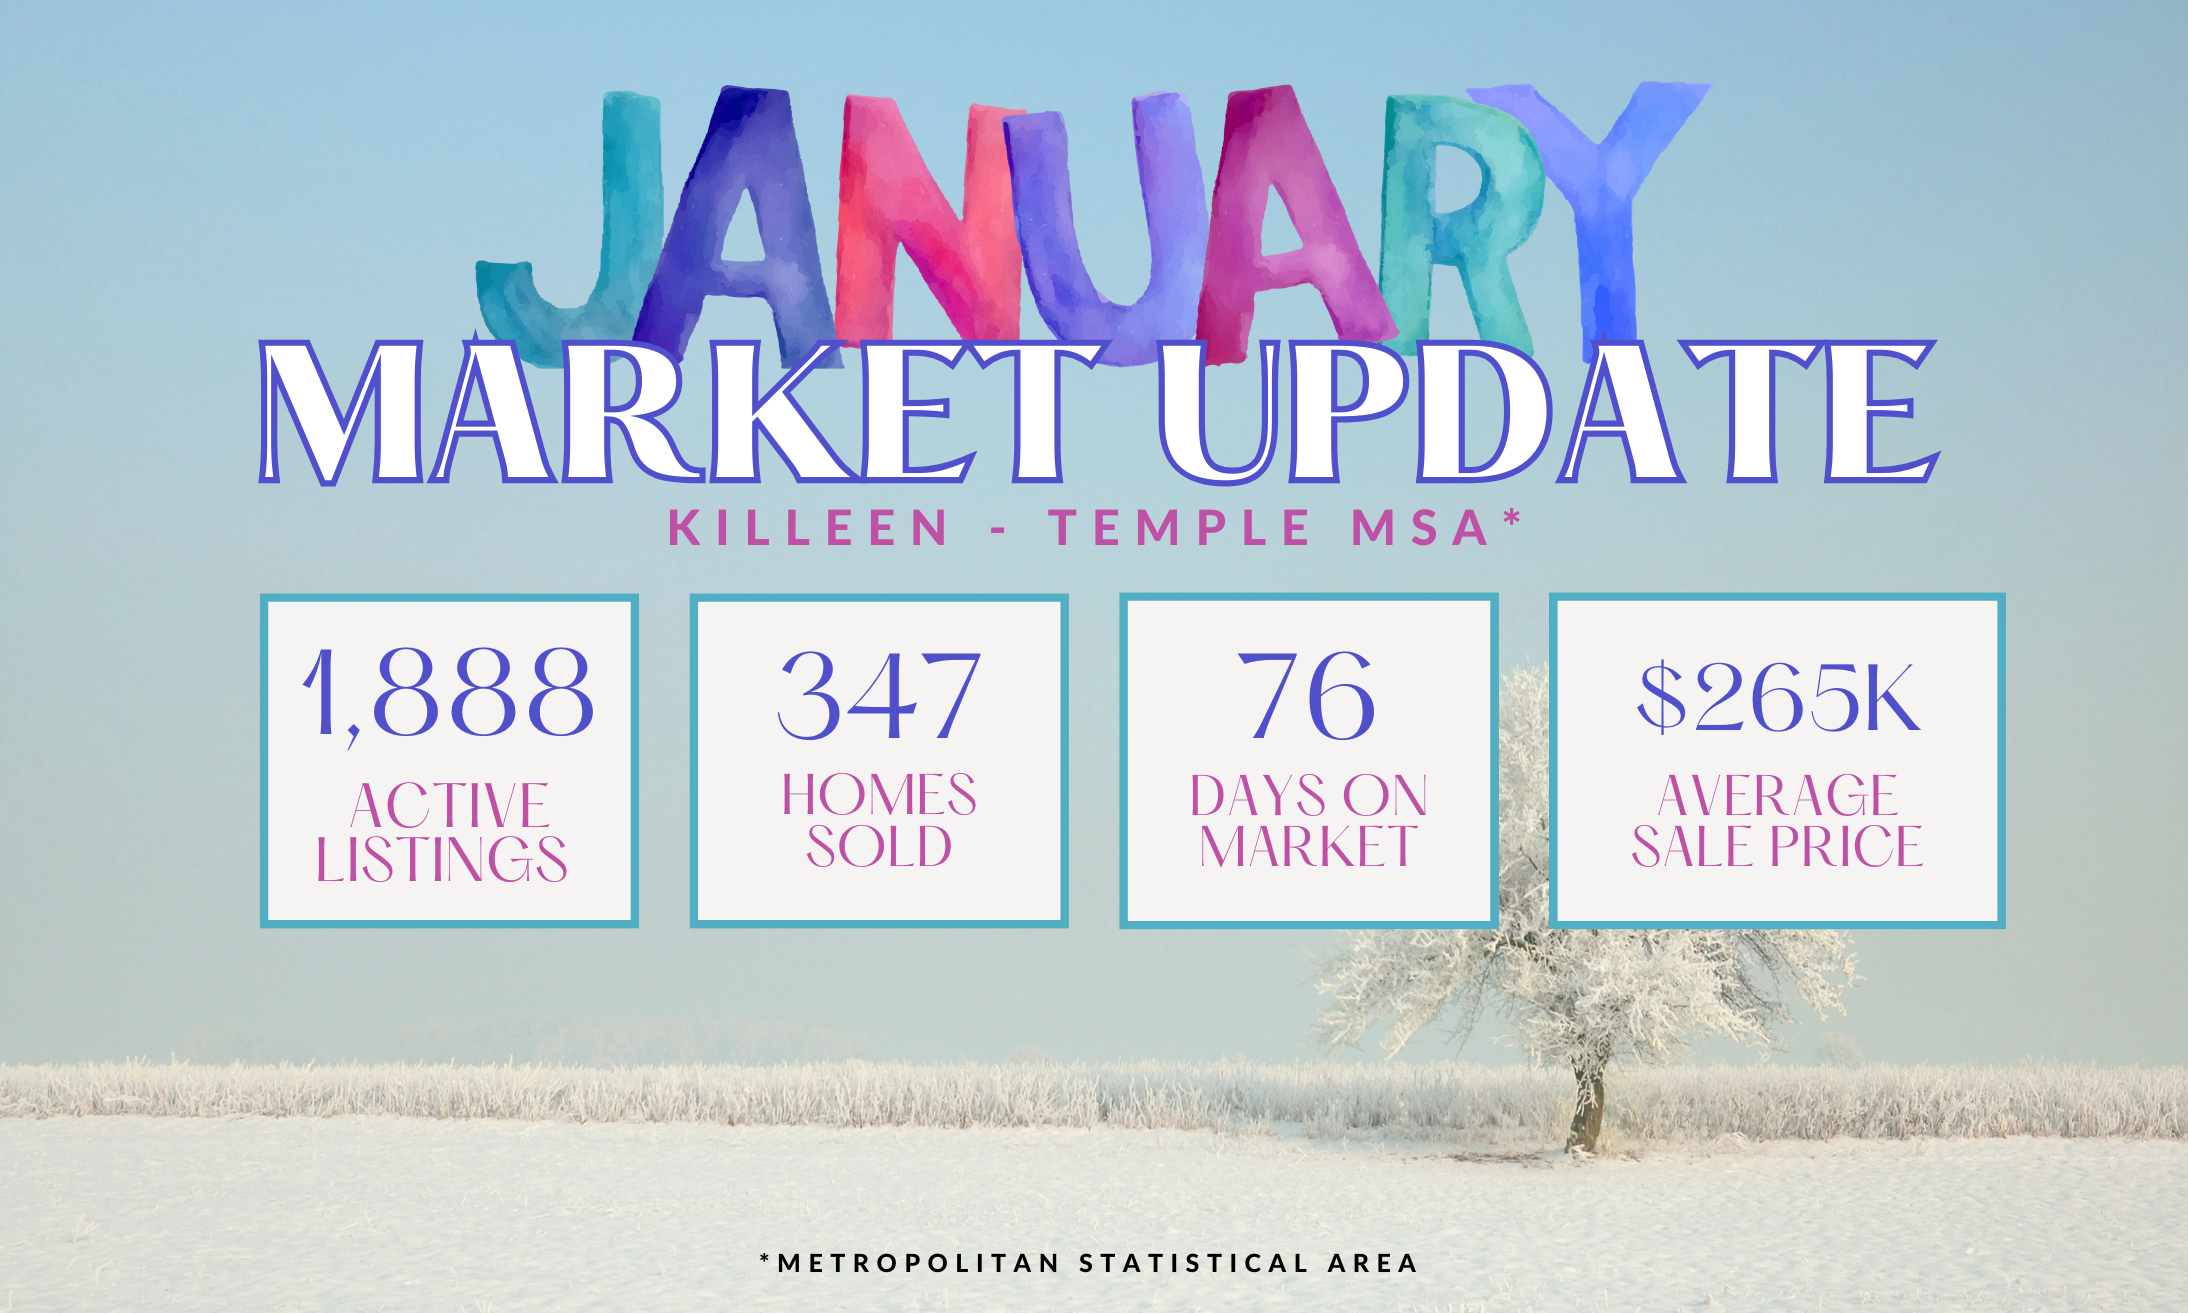
Please keep in mind this is for the entire metropolitan area. If you want zip code specific stats, I am happy to get them to you!
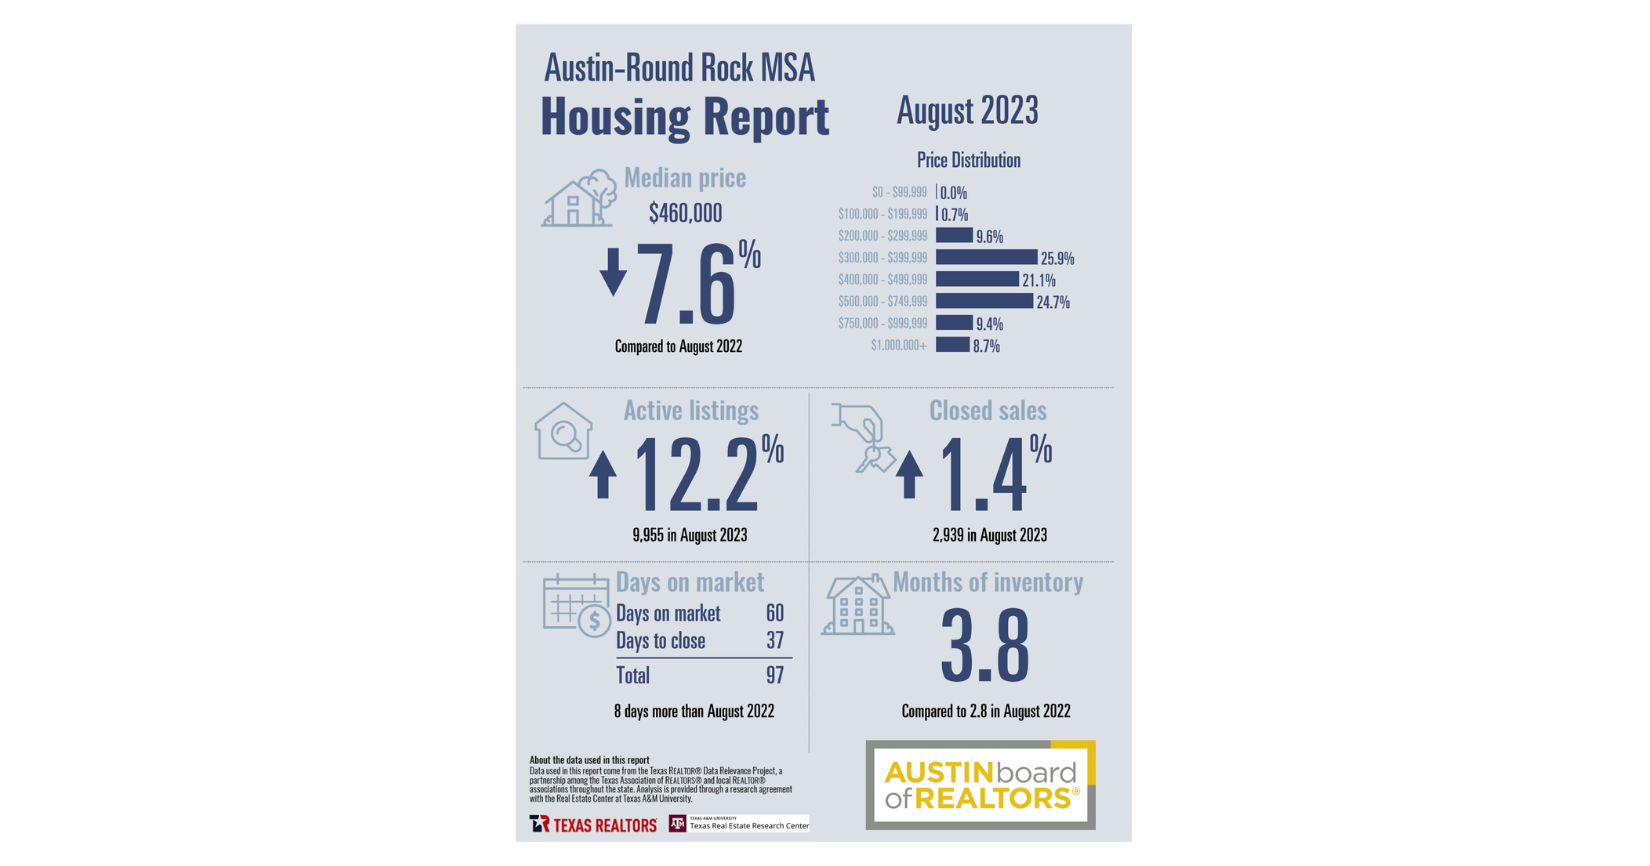
First off, we have the Months Supply of Inventory, which currently stands at 3.8. This metric represents the number of months it would take to sell all the available homes on the market, given the current sales pace. A lower supply indicates a seller’s market, where demand exceeds supply, potentially leading to increased competition among buyers.
Next, let’s consider the 12-month change in Months of Inventory, which shows an increase from 2.8 months of inventory last year. This change indicates a shift in the market dynamics. It suggests that compared to the previous year, there are now more homes available for sale, potentially giving buyers more options to choose from and reducing the level of competitiveness.
Moving on, we have the Median Days homes are on the market, which currently stands at 60. This metric represents the average number of days it takes for a home to sell. The days on market represents that it takes an average of 60 days to go under contract, but a total of 97 days from listing to closing. A lower number of days indicates a faster-paced market, where homes are being snatched up quickly. On the other hand, a higher number may signal a slower market, providing buyers with more time to consider their options.
Lastly, we have the Median Sold Price, which currently sits at $460,000. This metric represents the middle point of all the home prices sold in a given time period. It serves as an indicator of the overall market value. A higher median sold price may suggest a strong market with high demand and limited supply.
Now, let’s tie all these metrics together. The increase in the Months Supply of Inventory (+) implies that there are more homes available for sale compared to the previous year. This increase in supply could potentially lead to a more balanced market, offering buyers more options and potentially reducing competition. Despite the increase in supply, the Median Days homes are on the market indicates that homes are still selling (only up 8 days from last August). This suggests that there is still some demand in the market, even with the increased inventory. Finally, the Median Sold Price reflects the overall market value. With a decrease in median sold price from last year, it suggests that the market is starting to see a shift.
In conclusion, these real estate metrics provide a snapshot of the current market conditions. The increase in supply, along with average time on market and a slight decrease in the median sales price, suggests we may be approaching a more balanced and competitive market in the near future. As Buyers and Sellers, understanding these metrics can help you make informed decisions and navigate the ever-changing real estate landscape.
Leave A Comment