

![]()
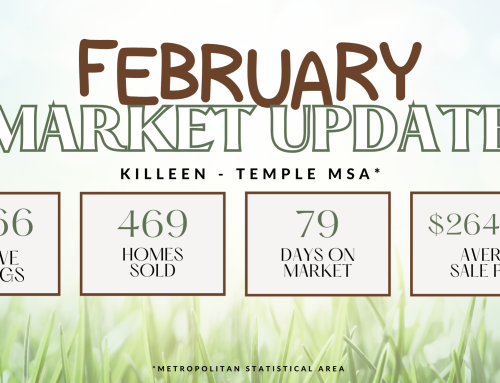
Please keep in mind this is for the entire Killeen-Temple *metropolitan statistical area (MSA). If you want zip code specific stats, I am happy to get them to you!
First up, we have the Months Supply of Inventory, which currently stands at 3.6. This number tells us how long it would take for all the current homes on the market to be sold if no new listings were added. A lower number like this typically indicates a seller’s market, where demand is high and supply is limited.
Next, we have the 12-Month Change in Months of Inventory, which has seen a significant increase from 2.0 months in January 2023. This means that there has been a notable uptick in the number of homes available for sale over the past year. While this can provide more options for buyers, it may also indicate a shifting market dynamic.
Moving on to the Median Days Homes are On the Market, which is 76. This metric shows us how long it typically takes for a home to go under contract once it is listed. A lower number suggests a faster-moving market, where homes are in high demand and selling quickly.
Lastly, we have the Median Sold Price, which currently sits at $265,000, an increase in 0.7% from January 2023. This number gives us an idea of the average price at which homes are selling in the market. It’s important for both buyers and sellers to be aware of this figure to ensure they are making informed decisions.
In conclusion, these real estate metrics are all interconnected and provide valuable insights into the current market conditions. Whether you are a buyer or a seller, understanding these metrics can help you navigate the real estate market with confidence. So, keep an eye on these numbers and make informed decisions to achieve your real estate goals!

Leave A Comment