The Biggest Mistakes Buyers Are Making Today

By |2024-06-01T16:30:48-05:00June 1, 2024|Real Estate|

Buyers face challenges in any market – and today’s is no different. With higher mortgage rates and rising prices, plus the limited supply of homes for sale, there’s a lot to consider. But, there's one way to avoid getting tripped up – and that’s leaning on a real estate agent for the best possible advice. An expert’s insights will help you avoid some of the most common mistakes homebuyers are making right now. Putting Off Pre-approval As part of the homebuying process, a lender will look at your finances to figure out what they’re willing to loan you for your mortgage. This gives you a good idea of what you can borrow so [...]

Austin-Round Rock Area February 2024 Housing Report

By |2024-03-17T13:27:30-05:00March 17, 2024|Market Reports|

*Please keep in mind this is the Metropolitan Statistical Area (MSA) for the Austin-Round Rock area. If you want specific stats relative to your zip code, please reach out so I can get them to you!* Hey there, buyers and sellers! Let's talk about some key real estate metrics that can give you a better understanding of the current market conditions. First off, we have the Months Supply of Inventory, which is sitting at a healthy 3.2 months. This means that if no new homes were to come on the market, it would take about 3.2 months to sell all [...]

Austin-Round Rock Area January 2024 Housing Report

By |2024-02-20T10:22:56-06:00February 15, 2024|Market Reports|

Please keep in mind this is the Metropolitan Statistical Area (MSA) for the Austin-Round Rock area. If you want specific stats relative to your zip code, please reach out so I can get them to you! Whether you're a buyer or a seller, the information contained in the infographic above is crucial in navigating the ever-changing real estate market. So, let's jump right in! First up, let's look at the Months Supply of Inventory, which currently stands at 3.0. This metric represents the number of months it would take to sell all the homes on the market if no new [...]

Austin-Round Rock Area November Housing Report

By |2023-12-22T12:12:38-06:00December 22, 2023|Market Reports|

Please keep in mind this is the Metropolitan Statistical Area (MSA) for the Austin-Round Rock area. If you want specific stats relative to your zip code, please reach out so I can get them to you! Whether you're a buyer or a seller, the information contained in the infographic above is crucial in navigating the ever-changing real estate market. So, let's jump right in! First up, we have the Months Supply of Inventory, which currently stands at 3.7. This metric represents the number of months it would take to sell all the homes on the market if no new listings [...]

Are the Top 3 Housing Market Questions on Your Mind?

By |2023-12-01T11:30:12-06:00December 1, 2023|Real Estate|

When it comes to what’s happening in the housing market, there’s a lot of confusion going around right now. You may hear one thing in conversation with your friends, see something totally different on the news, and read something on social media that contradicts both of those thoughts. And, if you’re thinking about making a move, that can leave you with a lot of lingering questions. That’s where a trusted local real estate agent comes in. Here are the top 3 questions people are asking about today’s housing market, and the data to help answer them. 1. What’s Next for Mortgage Rates? Mortgage rates are [...]

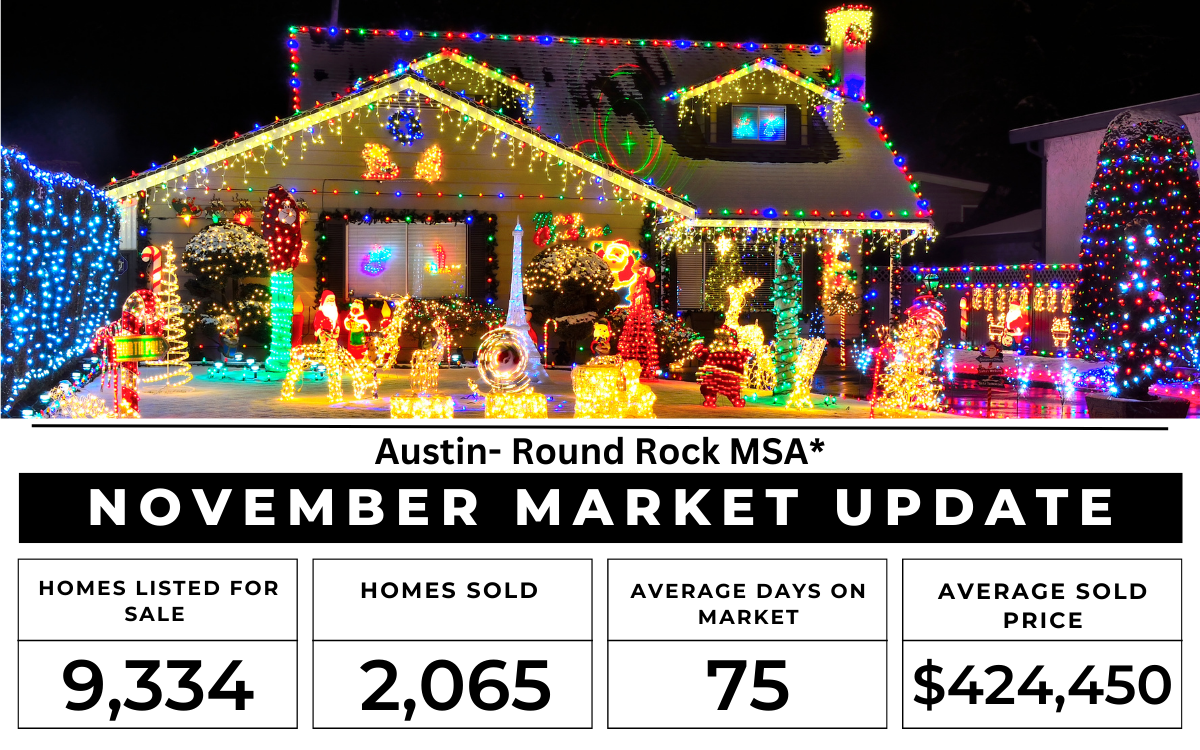
Austin- Round Rock MSA October Housing Report

By |2023-11-18T11:39:09-06:00November 15, 2023|Market Reports|

Please keep in mind this is for the entire *metropolitan statistical area. If you want zip code specific stats, I am happy to get them to you! First up, we have the "Months Supply of Inventory," which currently stands at 3.9. Now, what does this mean? Well, this metric tells us how many months it would take to sell all the homes on the market if no new listings were added. Essentially, it's a measure of supply and demand. A lower number indicates a seller's market, with limited inventory and potentially higher prices. In contrast, a higher number suggests a [...]

Austin- Round Rock MSA September Housing Report

By |2023-10-18T10:49:14-05:00October 12, 2023|Market Reports|

Please keep in mind this is for the entire *metropolitan statistical area. If you want zip code specific stats, I am happy to get them to you! Hey Austin area buyers and sellers! Ashley Billins, your trusted REALTOR® here with an exciting market update for September 2023! Let's dive into the latest trends and numbers that will help you make informed decisions. Did you know that currently, there's a 4.0 Months Supply of Inventory in the Austin metropolitan area? That means we are approaching a more healthy balance between supply and demand. Similarly, over the last 12 months, the Months [...]

Austin- Round Rock MSA August 2023 Housing Report

By |2023-09-14T17:37:52-05:00September 14, 2023|Market Reports|

Please keep in mind this is for the entire metropolitan area. If you want zip code specific stats, I am happy to get them to you! First off, we have the Months Supply of Inventory, which currently stands at 3.8. This metric represents the number of months it would take to sell all the available homes on the market, given the current sales pace. A lower supply indicates a seller's market, where demand exceeds supply, potentially leading to increased competition among buyers. Next, let's consider the 12-month change in Months of Inventory, which shows an increase from 2.8 months of [...]

Austin Residential Market Trends

By |2023-07-17T11:18:10-05:00July 17, 2023|Market Reports|

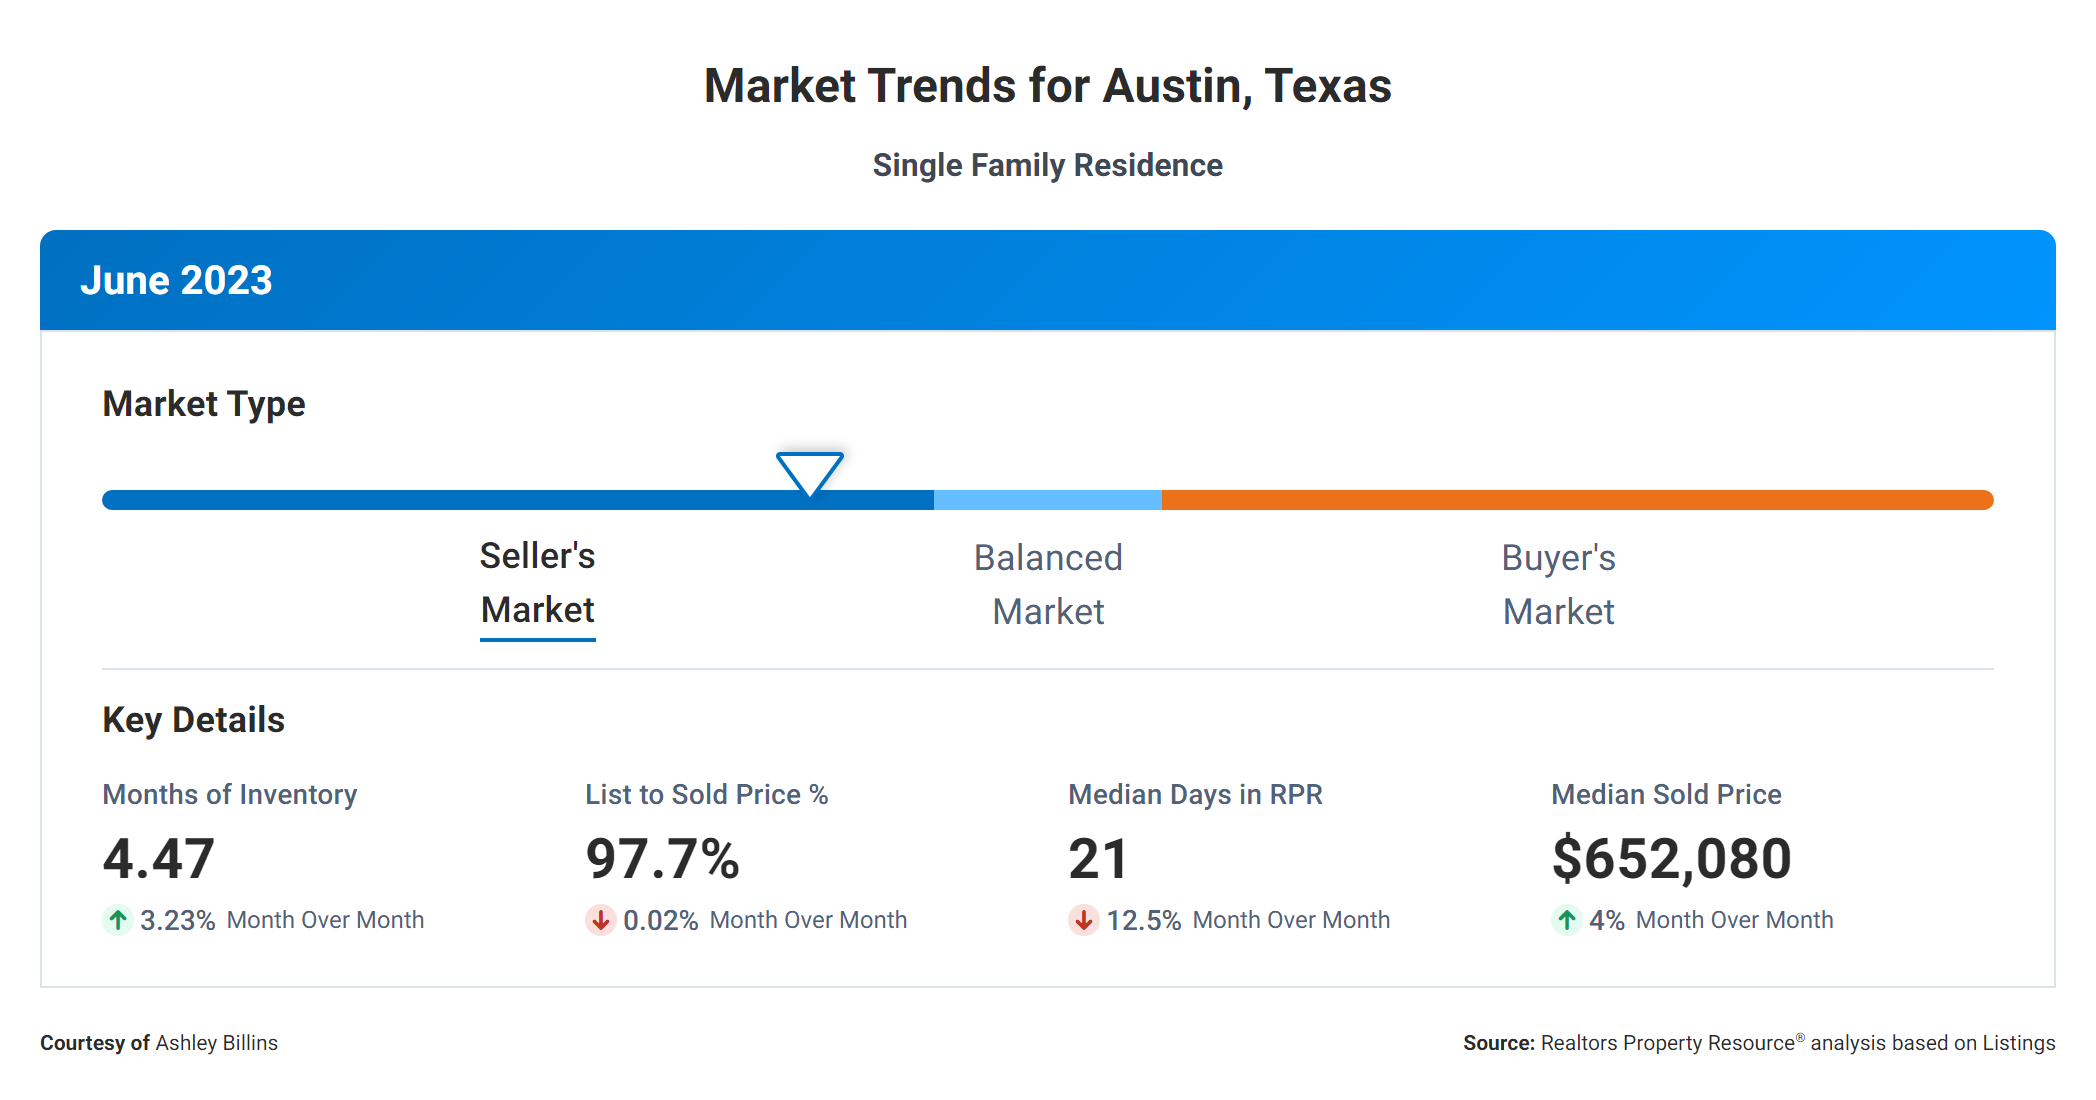
June 2023 Market Update for Austin, Texas  The Austin real estate market is sizzling, and here are the latest market trends you need to know: 1️⃣ Inventory Update: Currently, there are only 4.47 months supply of inventory in Austin. This means there is high demand and limited supply. 2️⃣ Inventory Growth: Over the last 12 months, the Months Supply of Inventory has surged by an impressive +92.67%. This indicates a rapidly evolving market. 3️⃣ List to Sold Price: The List to Sold Price percentage stands strong at 97.7%. This shows that sellers are receiving close to their asking price, giving [...]

Go to Top